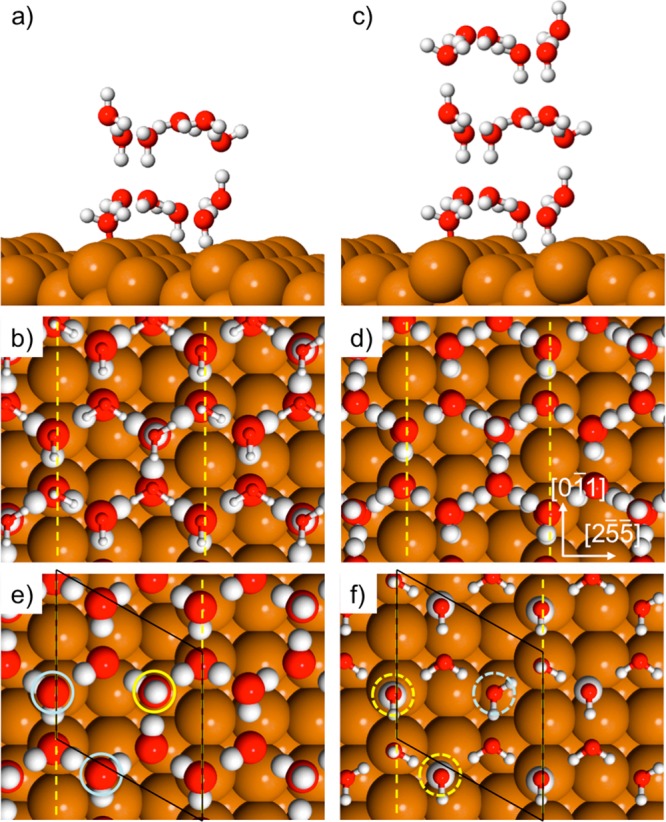
Figure 5.

Calculated structures showing the best 2 and 3 layer structures found in a (3 0, −1 1) unit cell. Side and top view of (a–b) 2 ML water and (c–d) 3 ML water (adsorption energy −71.8 and −71.6 kJ/mol respectively). The top frames show a single unit cell of water, while the top layer in (b) is reduced in size. Frames (e,f) show the first and second layers of the 2 layer structure separately. The three first layer sites (e) that link the two layers are circled with the H-up donor in yellow and the acceptor sites in blue. Frame (f) shows the corresponding second layer donor/acceptor sites highlighted by dashed circles, with the H donors enlarged. Copper step sites are indicated by the yellow dashed lines.
