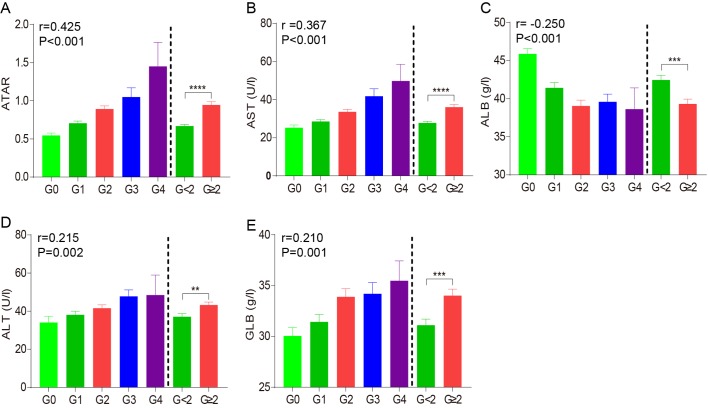
Figure 2.
Histograms displaying the (A) ATAR ratio, as well as the levels of (B) AST, (C) ALB, (D) ALT and (E) GLB for patients with different Scheuer score of liver necroinflammation in the experimental assessment cohort. **P<0.01, ***P<0.001 and ****P<0.0001. AST, aspartate aminotransferase; ATAR, AST to ALB ratio; ALB, albumin; ALT, aminotransferase; GLN, globulin.

