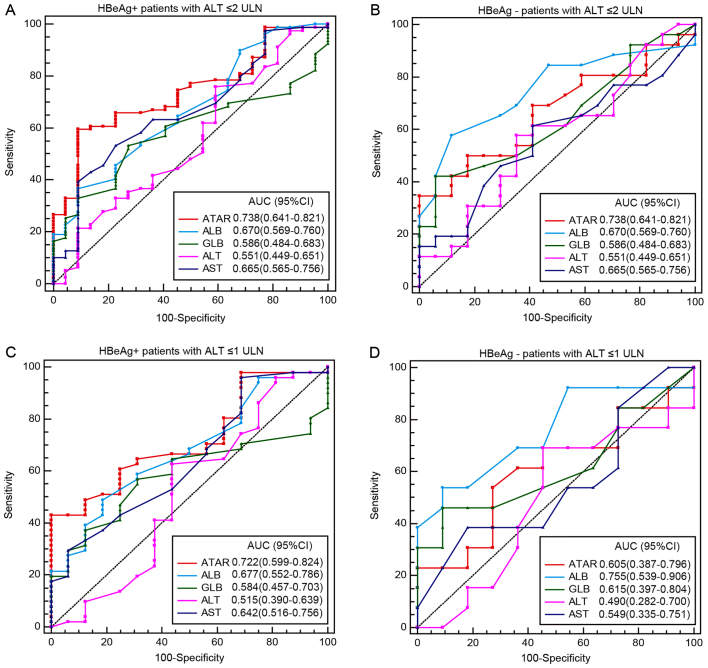
Figure 3.
Receiver operating characteristic curves of non-invasive biomarkers, including the ATAR ratio and the levels of AST, ALB, ALT and GLB for prediction of significant liver necroinflammation in HBeAg+ patients with (A) ALT ≤2 ULN (the cut-off values were as follows: 0.617 for ATAR, 41.9 for ALB, 30 for GLB, 22 for ALT and 29 for AST), (B) HBeAg− patients with ALT ≤2 ULN (the cut-off values were as follows: 0.830 for ATAR, 43 for ALB, 34 for GLB, 37 for ALT and 25 for AST), (C) HBeAg+ patients with ALT ≤1 ULN (the cut-off values were as follows: 0.617 for ATAR, 42.9 for ALB, 30 for GLB, 32 for ALT and 16 for AST) and (D) HBeAg− patients with ALT ≤1 ULN (the cut-off values were as follows: 0.5 for ATAR, 42. for ALB, 34 for GLB, 26 for ALT and 18 for AST). AST, aspartate aminotransferase; ATAR, AST to ALB ratio; ALB, albumin; ALT, aminotransferase; GLN, globulin; ULN, upper limit of normal; AUC, area under curve; CI, confidence interval; HBeAg, hepatitis B e antigen.

