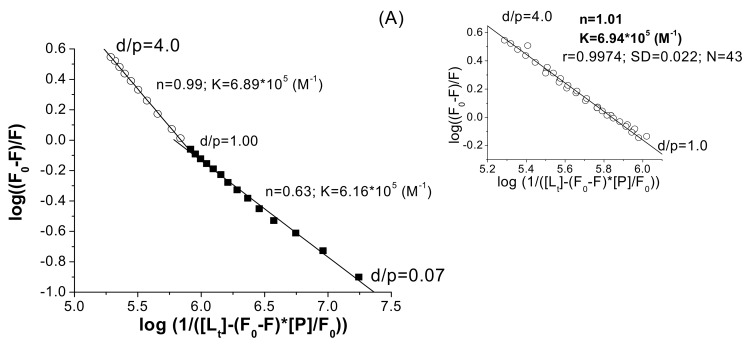
Figure 5.
(A) Two linear segments fitting plot for the HSA–I system to Equation (6); [HSA] = 3×10⁻⁶ M; λex = 286 nm; λem = 345 nm; inset, a triplicate experiments for d/p ≥ 1.0, fitted to Equation (6). (B) Two linear segments fitting plot for the BSA–I system to Equation (6); [BSA] = 3×10⁻⁶ M; λex = 286 nm; λem = 346 nm.

