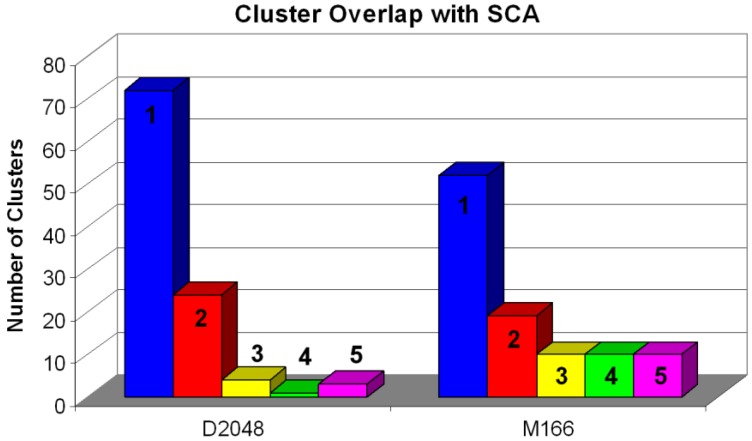
Figure 9.
Seed libraries selected by D1 and D2 are validated by the SCA approach. The blue bar depicts the number of selected clusters, which exactly overlap with SCA derived clusters. The red bar depicts the number of selected clusters, which overlap with exactly 2 SCA derived clusters; yellow, green, and purple represent 3, 4, and 5 overlapping SCA clusters, respectively.

