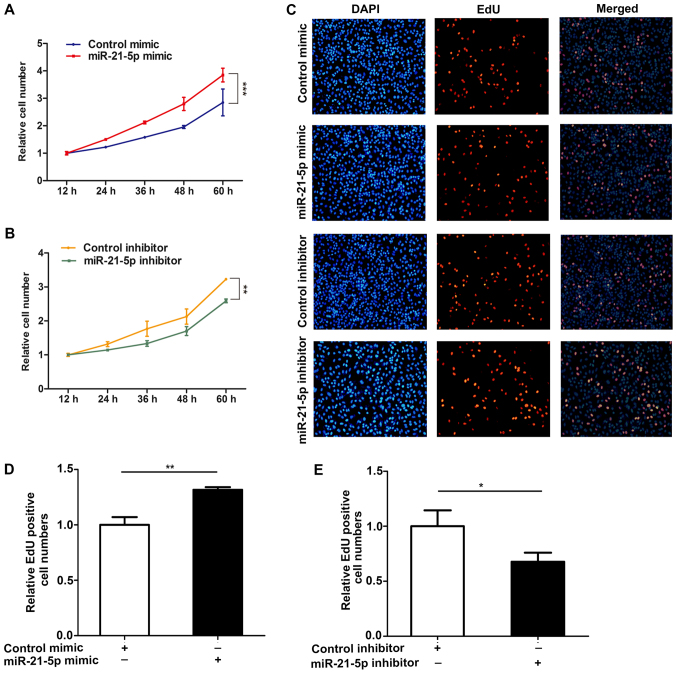
Figure 2.
miR-21-5p promotes cell proliferation. (A) Cell proliferation curve of A549 cells transfected with the control mimic or miR-21-5p mimic. (B) Cell proliferation curve of A549 cells after transfection with equal doses of the control inhibitor or miR-21-5p inhibitor. (C-E) EdU assays performed in A549 cells transfected with equal doses of control mimic, miR-21-5p mimic, control inhibitor, or miR-21-5p inhibitor, and the EdU positive cells were observed at 565 nm using a fluorescence inverted microscope (magnification, ×200). (C) Representative images; (D) mimic and (E) inhibitor quantitative analysis. The results were expressed as mean ± SD of three independent experiments (n=3; *P<0.05; **P<0.01; ***P<0.001).

