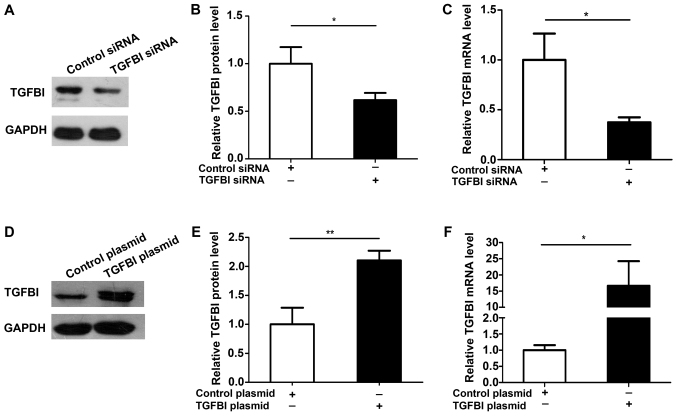
Figure 5.
Overexpression and knockdown efficiency of TGFBI. (A and B) Western blotting analysis of the TGFBI protein expression levels in A549 cells transfected with control siRNA or TGFBI siRNA. (A) Representative image; (B) quantitative analysis. (C) RT-qPCR analysis of the TGFBI mRNA expression levels in A549 cells transfected with control siRNA or TGFBI siRNA. (D and E) Western blotting analysis of the TGFBI protein expression levels in A549 cells transfected with control plasmid or TGFBI plasmid. (D) Representative image; (E) quantitative analysis. (F) RT-qPCR analysis of the TGFBI mRNA expression levels in A549 cells transfected with control plasmid or TGFBI plasmid. The results were expressed as mean ± SD of three independent experiments (n=3; *P<0.05; **P<0.01).

