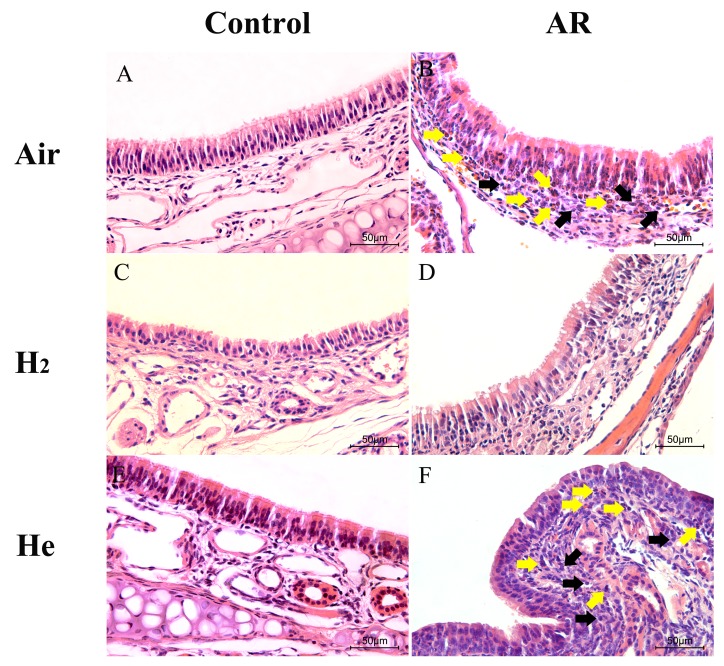
Figure 3.
Effect of hydrogen inhalation on nasal mucosa inflammation. Representative sections of the nasal tissues (original magnification, ×400) after hematoxylin and eosin staining. (A) The control group. (B) The AR group. (C) The control + H2 group. (D) The AR + H2 group. (E) The control + He group. (F) The AR + He group. Yellow arrows indicate eosinophils; black arrows indicate lymphocytes. H2, hydrogen gas; He, helium gas; AR, allergic rhinitis.

