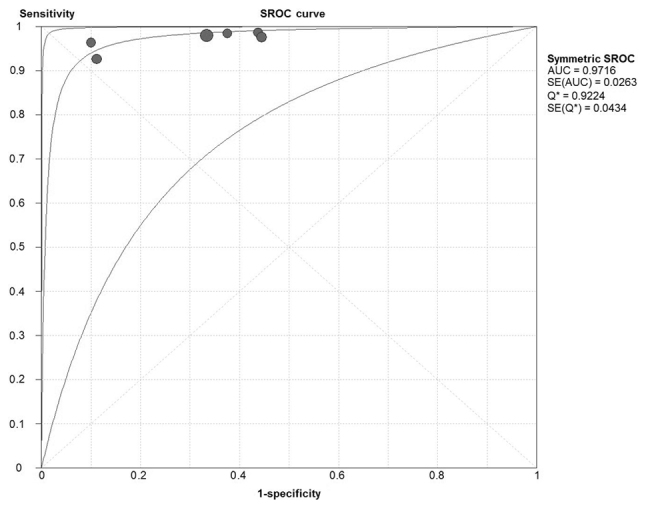
Figure 1.

SROC curve for meta-analysis of studies assessing magnetic resonance angiography for diagnosing Budd-Chiari syndrome. Each circle represents an individual research study. The size of the circle is proportional to the sample size of the study. The best-fitting curve lies between the other 2 curves demarcating its 95% confidence interval. SROC, summary receiver operating characteristic; AUC, area under the curve; SE, standard error.
