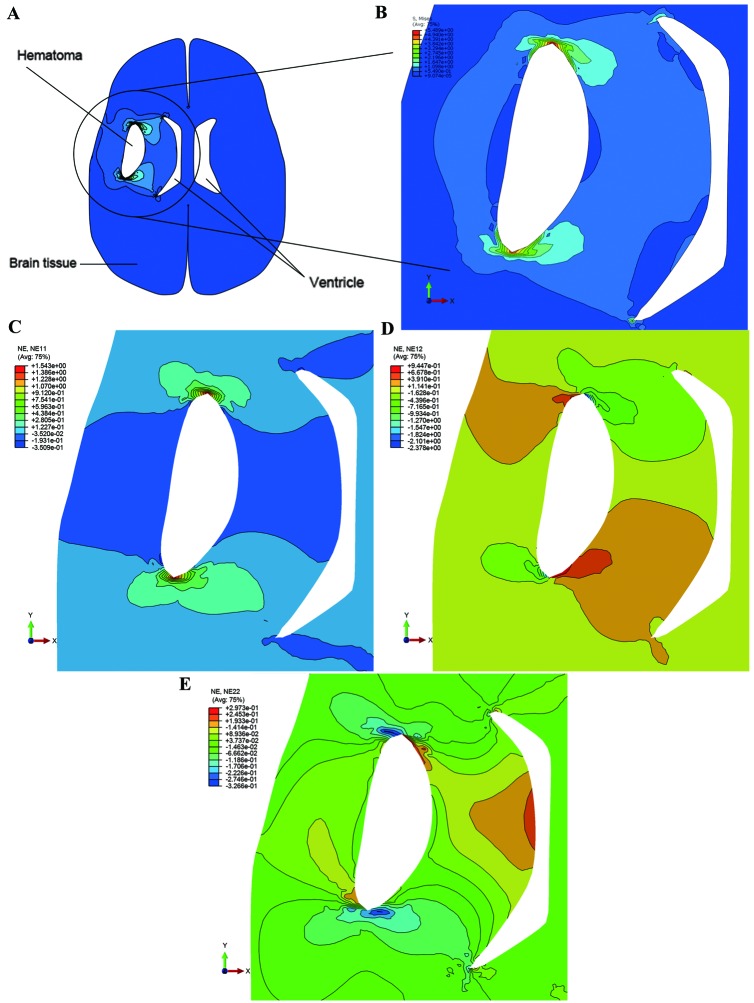
Figure 7.
Von Mises stress and strain distributions in the simulation of intracerebral hemorrhage. (A) Deformation of whole parenchyma after hematoma accumulation. (B) Distribution of the stress concentration. Deformation distributions in (C) NE11, (D) NE22 and (E) NE12 direction. NE11, horizontal direction; NE22, shear direction; NE12, vertical direction.

