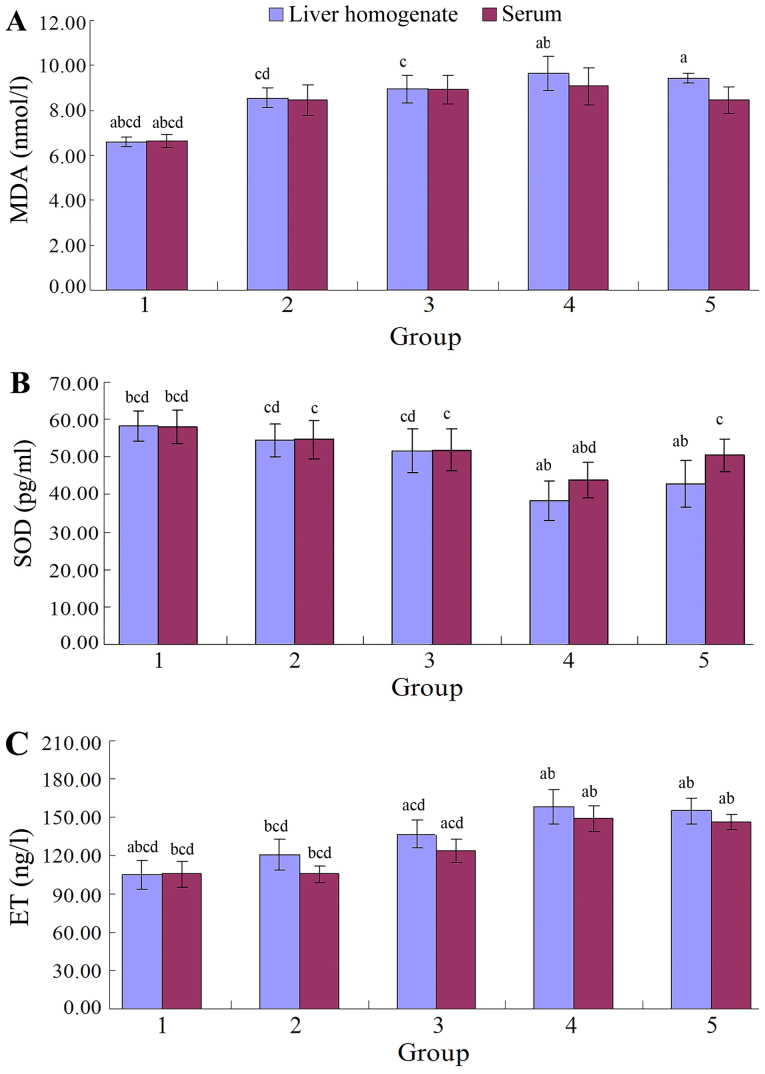
Figure 4.
(A) MDA, (B) SOD and (C) ET levels in the liver homogenate and serum of the control and the experimental animal group at various time-points. MDA and ET increased post-operatively prior to reaching a peak by 6 weeks and decreasing slightly by 12 weeks. SOD decreased post-operatively prior to reaching a peak by 6 weeks and increasing slightly by 12 weeks. Groups: 1, control group; 2–5, experimental subgroup at 1, 3, 6 and 12 weeks, respectively. aP<0.05 vs. 1 week experiment group; bP<0.05 vs. 3 weeks experiment group; cP<0.05 vs. 6 weeks experiment group; dP<0.05 vs. 12 weeks experiment group; MDA, malondialdehyde; SOD, superoxide dismutase; ET, endotoxin.

