Figure 1.
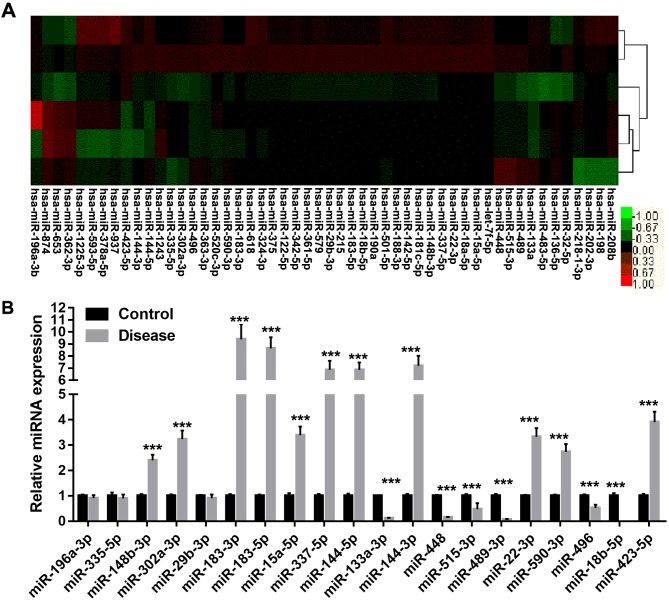
Differentially expressed miRNAs in alveolar ridge atrophy and normal tissue samples were analyzed by miRNA microarray and RT-qPCR. (A) Heat map of unsupervised hierarchical clustering analysis based on the 52 miRNAs identified in the tissue samples. (B) RT-qPCR analysis of the expression of 20 selected miRNAs in the alveolar ridge atrophy and normal tissue samples. ***P<0.001 vs. control Values are expressed as the mean ± standard deviation. RT-qPCR, reverse transcription-quantitative polymerase chain reaction; miRNA, microRNA; hsa, Homo sapiens.

