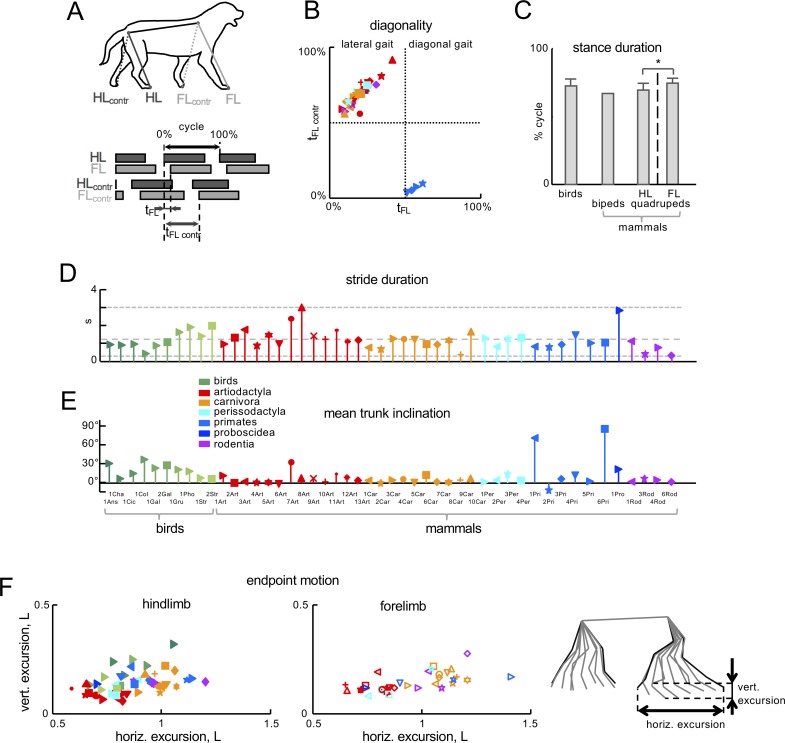
(A) Schematic drawing of a walking dog with stick diagram indicating the distal points analyzed and limb contact pattern on the bottom. HL, FL refer to hindlimb and forelimb facing the recording camera, while HL
contr, FL
contr indicate the contralateral ones. Grey bars indicate the period of time in which each foot is in contact with the ground during the stride. (B) Mean FL phase lag (t
FL) values plotted versus contralateral FL values (t
FLcontr) for all animals. The phase lag was computed as the relative timing (t
FL, t
FLcontr) of the FL cycle onset with respect to HL, expressed as a percentage of the gait cycle (see panel A). (C) Relative duration of the stance phase (mean +SD across animals). Asterisk indicates significant differences between HL and FL of mammals (p<0.001). (D) Stride duration. (E) Mean trunk inclination during walking with respect to the horizon. (F) Endpoint motion. The stick diagram of a single stride of a walking dog illustrates limb segment movements relative to hip (for HL) and scapula (for FL). Bottom plots show vertical vs. horizontal limb endpoint excursions, normalized to the limb length (L equals to the sum of the lengths of thigh, shank, and foot segments). The data in panels B-F do not include animals marked by asterisks in
Table 1 (since this information is missing in
Fischer et al., 2002). Animals are labeled as in
Table 1 and different colors and markers refer to different taxonomic orders and species, respectively. Source files are available in the SourceData2-
Figure 2—figure supplement 2—souce data 1.zip file.


