. 2018 Oct 30;7:e38190. doi: 10.7554/eLife.38190

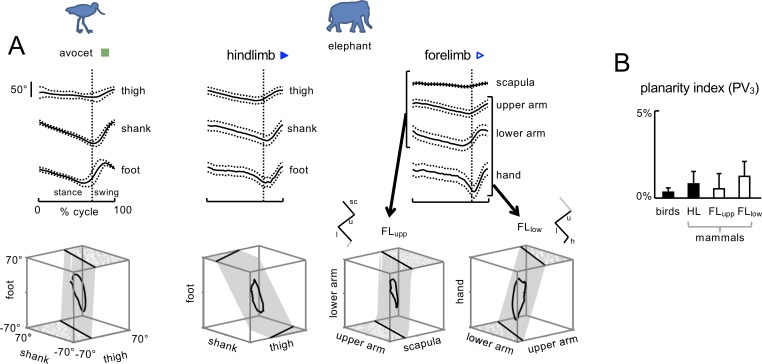
Figure 3. Planar covariation of limb segment angular motion.

(A) Ensemble-averaged (±SD across strides) limb segment elevation angles plotted vs.normalized gait cycle and three-dimensional gait loops with corresponding interpolation planes on the bottom are shown for one bird (avocet) and one mammal (elephant). For FL, planar covariation was examined using different tri-segmental FL models: FLupp – ‘scapula–upper arm–lower arm’ and FLlow – 'upper arm–lower arm–hand’. Note roughly similar orientation of the covariation plane between these two models of FL and different orientation compared to the HL model. (B) Planarity index expressed in percent of variance (PV) accounted for by the third principal component (PC) for HL and FL of animals (PV3 = 0 for ideal planarity). Source files are available in the SourceData3-Figure3.zip file.

Figure 3—source data 1. Planar covariation of limb segment motion.
DOI: 10.7554/eLife.38190.016

Figure 3.

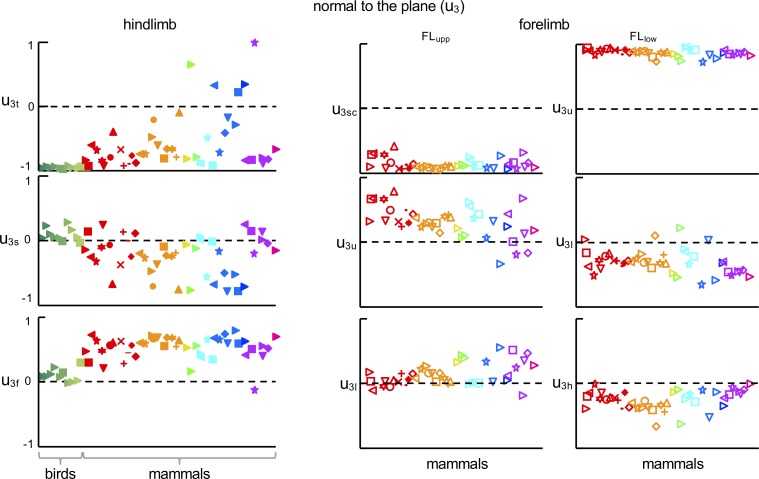
Figure 3—figure supplement 1. Direction cosines of the normal to the covariation plane (the dot product of u3 with the unit vector along each of the three axes: u3t, u3s, u3f for HL and u3sc, u3u, u3l and u3u, u3l, u3h for FLupp and FLlow, respectively) for all animals.

Figure 3—figure supplement 1.

Source files are available in the SourceData3-Figure 3—figure supplement 1—souce data 1.zip file.
Figure 3—figure supplement 1—source data 1. Direction cosine of the normal to the covariation plane.
DOI: 10.7554/eLife.38190.013
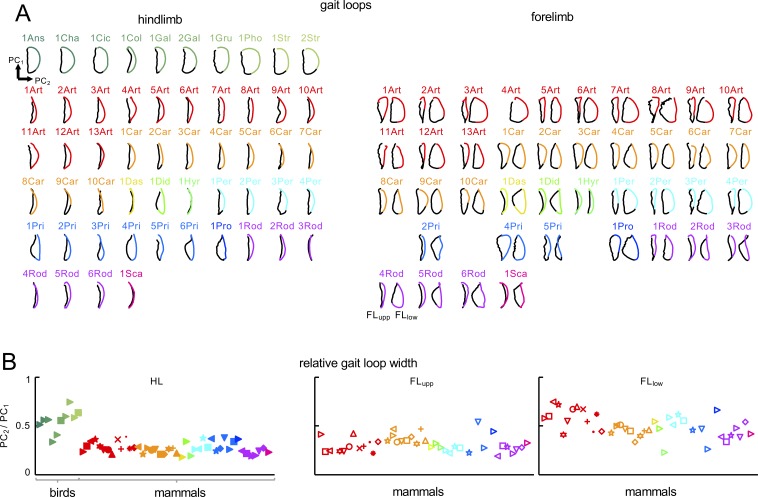
Figure 3—figure supplement 2. Gait loops in birds and mammals.

Figure 3—figure supplement 2.

(A) Bi-dimensional view of gait loops (Figure 3A) for each animal, projected on the covariation plane. Each loop is rotated so that the first and second principal components are aligned with the vertical and horizontal axes of the figure. Paths progress in time in the counter clockwise direction, touchdown and lift-off events (stance phase in black) corresponding to the top and bottom of the loops, respectively. Animal are labeled as in Table 1. For FL, gait loops for the FLupp and FLlow tri-segmental models are shown. (B) Relative gait loop width estimated as the amplitude (peak-to-peak) of PC2 relative to PC1. Note that the FLlow loop is wider than the HL loop for mammals and the HL loop is wider for birds than for mammals. Source files are available in the SourceData3-Figure 3—figure supplement 2—souce data 1.zip file.
Figure 3—figure supplement 2—source data 1. Gait loops.
DOI: 10.7554/eLife.38190.015