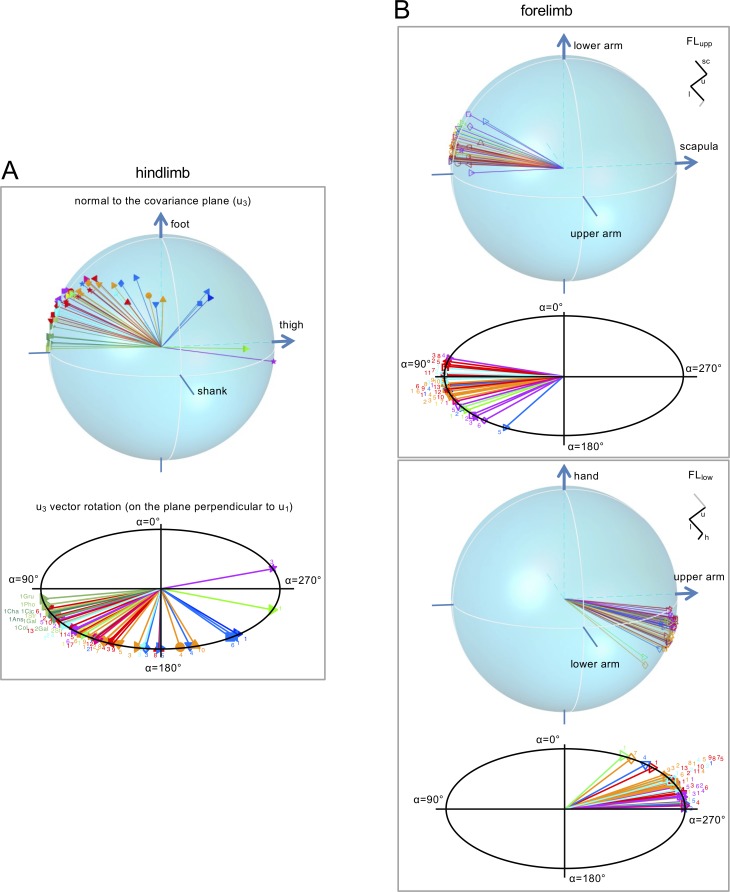
Figure 4. Orientation (u3 vector) of the covariation plane for the HL (A) and FL (B) segment elevation angles.
For FL, the normal to the plane for both FLupp and FLlow tri-segmental models are shown. Top panels: spatial distribution of the normal (u3) to the covariation plane in all animals. Each vector u3 yields one point corresponding to the projection of the plane normal onto the unit sphere, the axes of which are the direction cosines with the axes of segment elevation angles (u3t, u3s, u3f). Positive direction of the semi-axes is indicated by arrow. Lower panels: u3 vectors for different animals lay on the plane (perpendicular to the averaged u1 vector across animals), α - angle of rotation of u3 on this plane (α = 0 corresponds to the projection of the shank, upper arm and lower arm semi-axes on that plane for HL, FLupp and FLlow, respectively). Animals are labeled as in Table 1 and different colors and markers refer to different taxonomic orders and species, respectively. Note a higher data dispersion for HL compared to FL across animals. Source files are available in the SourceData4-Figure4.zip file.


