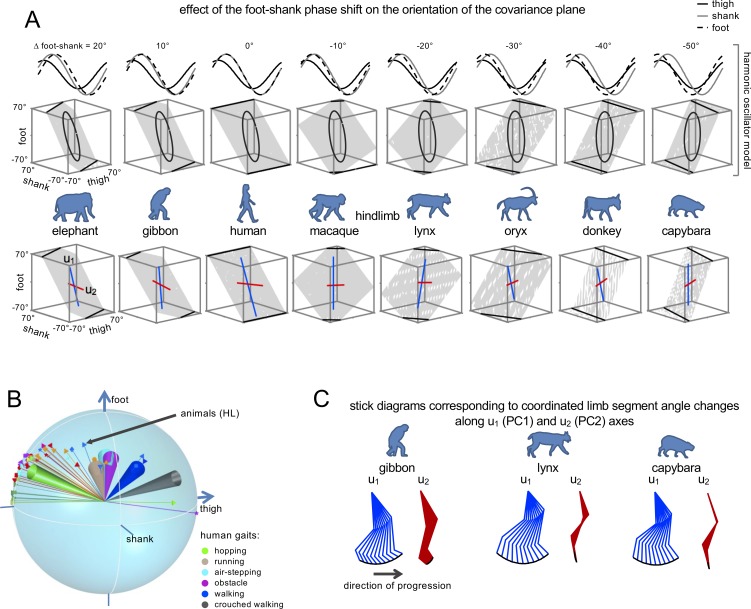
Figure 6. Inter-segmental coordination patterns.
(A) Effect of the foot-shank phase shift on the orientation of the covariation plane. Upper panels: Harmonic oscillator model of Barliya et al. (2009) approximating the three segment elevation angles by sinusoidal waveforms with specific phase and amplitude. By changing the phase of the foot segment waveform relative to the shank segment from 20° to −50° (corresponding to the same range of Δfoot-shank in Figure 5A), the covariation plane rotates similarly to the actual plane rotation across animals (lower panels, blue and red lines indicate the orientation of u1 and u2 vectors, respectively). (B) Similar plane of rotation of the u3 vector across animals (HL, Figure 4A) and different human gaits (indicated by colored confidence cones, the data are redrawn from Figure 2B in Ivanenko et al., 2007). (C) Examples of stick diagrams corresponding to the coordinated limb segment angle changes along u1 (PC1) and u2 (PC2) axes (indicated by color lines in panel A, bottom plots). Note that PC1 reproduces the whole limb orientation changes while PC2 is mainly associated with changes in the limb length. Source files are available in the SourceData6-Figure6.zip file.

