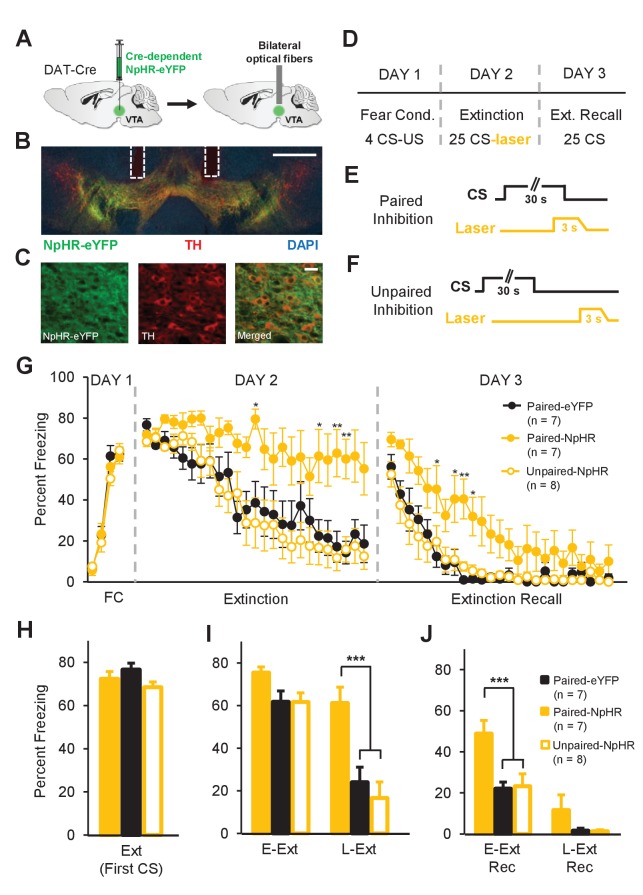
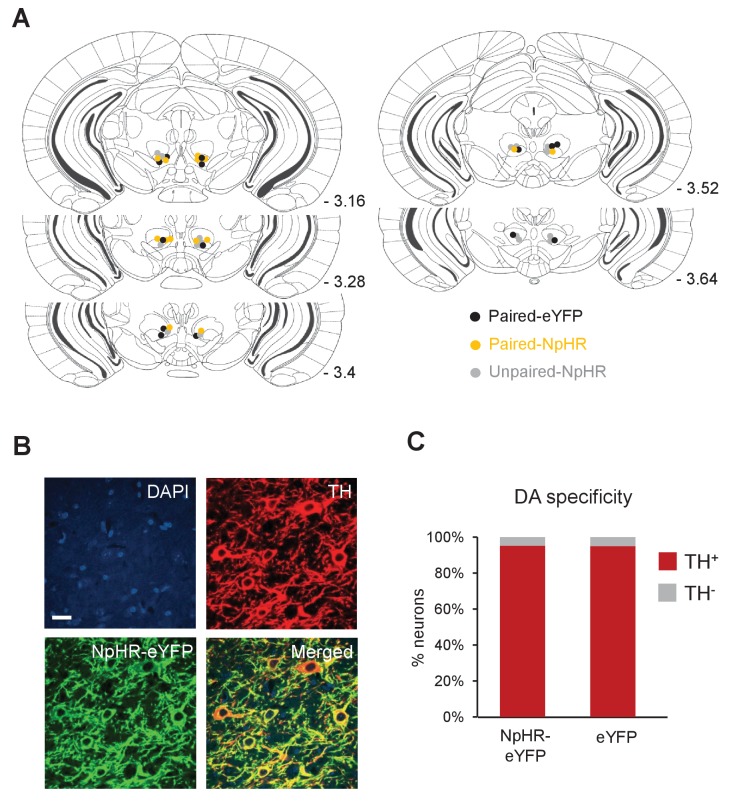
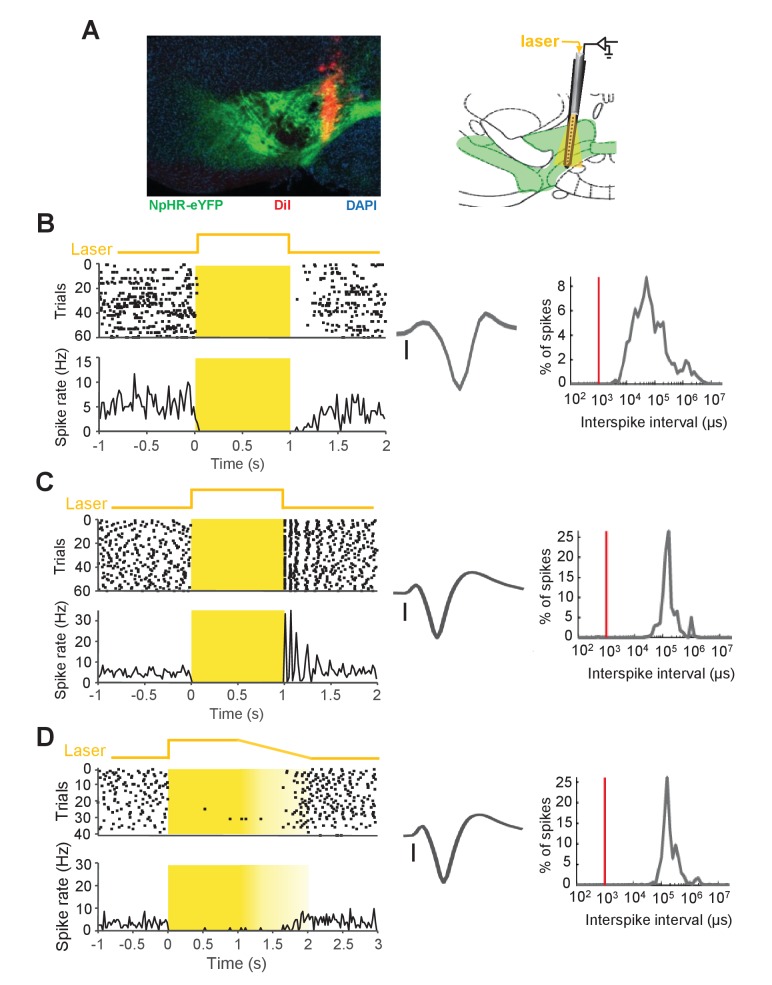
Figure 5. Inhibition of dopamine neuron firing at the time of the US omission impairs fear extinction learning.
(A) Schematic of the surgical procedure showing bilateral virus injection (left) and optical fiber implantation (right) in the VTA. (B) Example histological image showing Cre-dependent expression of NpHR-eYFP (green) along with immunostaining for tyrosine hydroxylase TH (red) and DAPI (blue) staining in the VTA. White vertical tracks indicate the bilateral optical fiber placements in the VTA. Scale bar: 0.5 mm. (C) Confocal images showing expression of NpHR-eYFP (left), TH (middle) and merged image (right) showing co-expression. Scale bar: 20 μm. (D) Schematic of the behavioral protocol. Fear Cond.: fear conditioning, Ext Recall: extinction recall. (E) Schematic of paired optogenetic inhibition of DA neurons at the time of the US omission. (F) Schematic of unpaired optogenetic inhibition during intertrial intervals. (G) Percent freezing to the CS during fear conditioning (FC), extinction and extinction recall sessions. The Paired-NpHR group showed impaired extinction learning and extinction recall. (**p<0.01, *p<0.05). (H) No difference in freezing to the CS between groups at the start of extinction (first CS). Ext: extinction. (I) Freezing levels during E-Ext (average of first 10 CSs) and L-Ext (average of last 10 CSs; two-way repeated measures ANOVA, main effect of group: F2,19 = 9.05, p = 0.0017; group × trial interaction: F2,19 = 7.38, p = 0.0043). The Paired-NpHR group (n = 7) showed significantly higher freezing to the CS compared to the Paired-eYFP (n = 7) and Unpaired-NpHR (n = 8) groups during L-Ext trials (***p<0.001). E-Ext: early extinction, L-Ext: late extinction. (J) Freezing levels during E-Ext Rec (average of first 10 CSs) and L-Ext Rec trials (average of last 10 CSs; two-way repeated measures ANOVA, main effect of group: F2,19 = 7.21, p = 0.0047). The Paired-NpHR group exhibited significantly higher freezing to the CS compared to the control groups during E-Ext Rec (***p<0.001). E-Ext Rec: early extinction recall, L-Ext Rec: late extinction recall. Error bars represent mean ± s.e.m. across animals.


