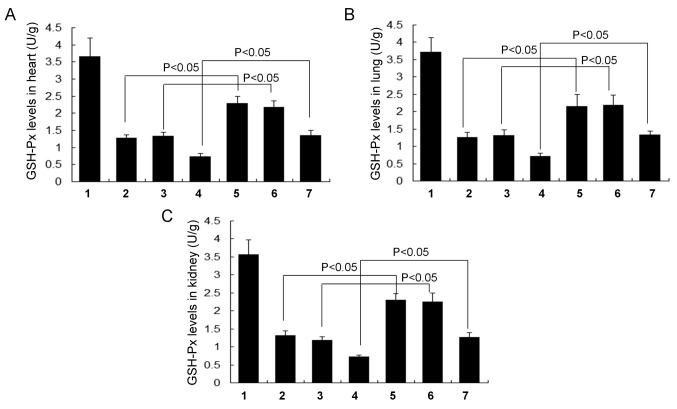
Figure 6.
Levels of the cellular antioxidant enzyme GSH-Px in different tissues. GSH-Px levels in the (A) heart, (B) lung and (C) kidney tissue. All data are presented as the mean ± standard deviation and were obtained from at least six independent experiments or tests. 1, Normal control group; 2, Normal obese group; 3, Normal asthma group; 4, Obese + asthma group; 5, RSV obese group; 6, RSV asthma group; 7, RSV obese + asthma group; RSV, resveratol; GSH-Px, glutathione peroxidase.

