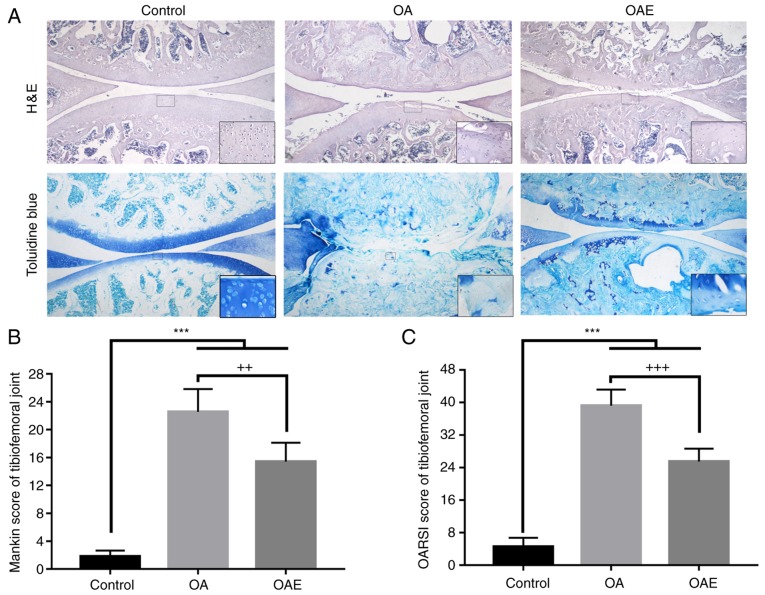
Figure 2.
Histological staining and evaluation of the tibiofemoral joint. (A) H&E and toluidine blue staining of sections in the sagittal plane. Images were captured at ×40 magnification, and local magnification of a selected square was used to observe the details for each group (×200 for H&E and ×400 for toluidine blue). (B) Mankin score and (C) OARSI score for the tibiofemoral joint. Differences between the control vs. OA, control vs. OAE, and OA vs. OAE groups were statistically significant. ***P<0.001, ++P<0.01 and +++P<0.001 vs. OA group. Results are expressed as the mean and 95% confidence interval (one-way analysis of variance; n=10 rats/group). OA, osteoarthritis; OAE, OA with treadmill exercise; H&E, hematoxylin and eosin.

