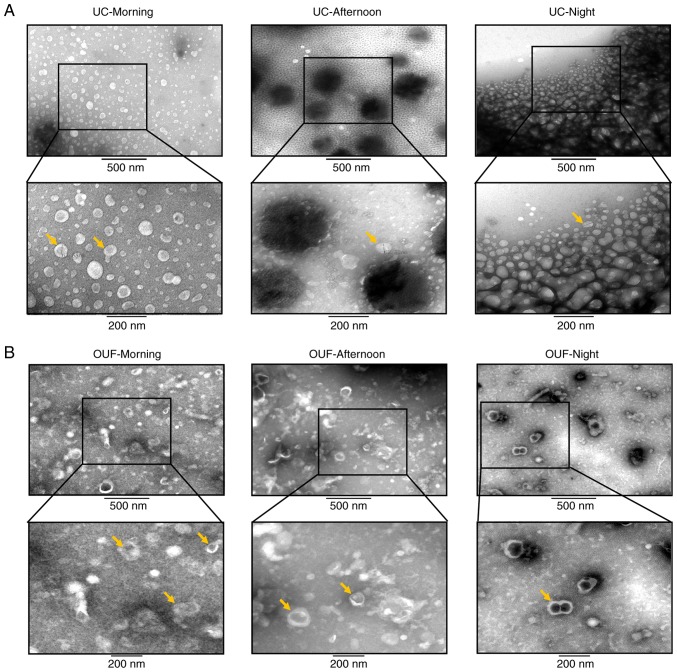
Figure 3.
Transmission electron microscopy analysis of urinary exosomes isolated using (A) UC and (B) OUF. Upper images show low magnification (×5,000) of exosomes (scale bar, 500 nm), while bottom images are at higher magnification (×20,000; scale bar, 200 nm). Yellow arrows indicate the exosomes. UC, ultracentrifugation; OUF, optimized ultrafiltration.

