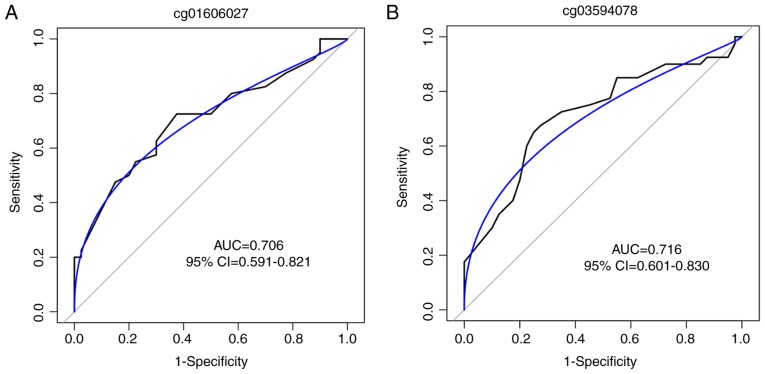
Figure 6.
ROC curves for the diagnosis of patients with congenital hypopituitarism. ROC curves according to the methylation levels of (A) cg01606027 on LIM domain kinase 2 and (B) cg03594078 on piwi-like RNA-mediated gene silencing 2, in the validation set. The blue line represents the binormal smoothed ROC curve for each CpG site. ROC, receiver-operating characteristic; AUC, area under the curve; CI, confidence interval.

