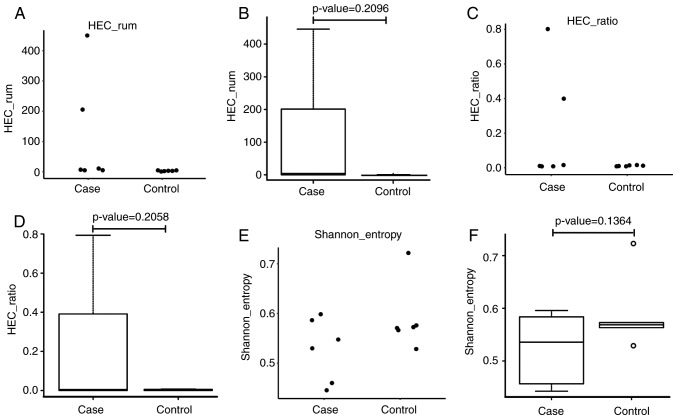
Figure 1.
Comparative analysis of B-cell diversity between the ACLF and control groups. (A) Values in the control group were concentrated, whereas values in the ACLF group were relatively dispersed. (B) A significantly skewed distribution was identified in the ACLF patient group, whereas a substantially normal distribution was identified in the control group (P=0.2096). (C) Scatterplot and (D) box plot of the HEC ratio show that the values in the control group were concentrated and the values in the ACLF group were relatively dispersed (P=0.2058). (E) Scatterplot and (F) box plot of Shannon entropy distribution for patients with ACLF and control subjects, show that the values for the control group were concentrated, whereas the values for the ACLF group were relatively dispersed. HEC, highly expanded clone; ACLF, acute-on-chronic liver failure.

