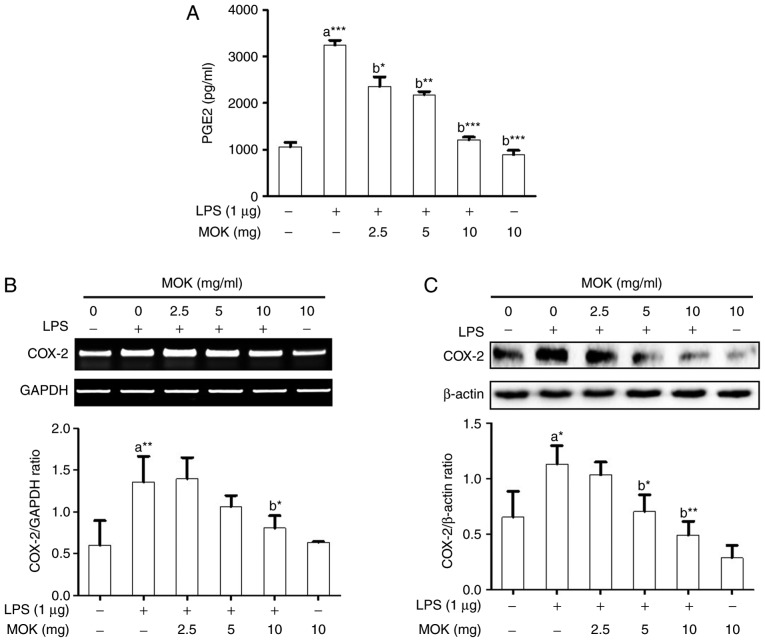
Figure 3.
Effects of MOK extract on the production of PGE2 and expression of COX-2 in RAW 264.7 cells stimulated by LPS. (A) After treatment with various concentrations of MOK extract for 30 min, cells were then stimulated with LPS. At 16 h, culture media were collected and measured by an enzyme immunoassay for PGE2 concentration. Data represent means ± standard error of the mean of three independent experiments. *P<0.05, **P<0.01 and ***P<0.001 vs. 1st bar, untreated control cells (a) or 2nd bar, cells treated with LPS only (b). (B) After treatment with MOK extract for 30 min, cells were stimulated with LPS for an additional 5 h. RT-PCR was used to measure the mRNA levels of COX-2 with GAPDH expression as an internal control. (C) After treatment with MOK extract for 30 min, cells were stimulated with LPS for an additional 24 h. Western blotting was used to analyze the protein level of COX-2 in total cell lysates with β-actin as an internal control. Mean densitometric values of the three independent experiments were analyzed and are expressed as bar charts. PGE2, prostaglandin E2; COX, cyclooxygenase; LPS, lipopolysaccharide; RT-PCR, reverse transcription-polymerase chain reaction; GAPDH, glyceraldehyde 3-phosphate dehydrogenase.

