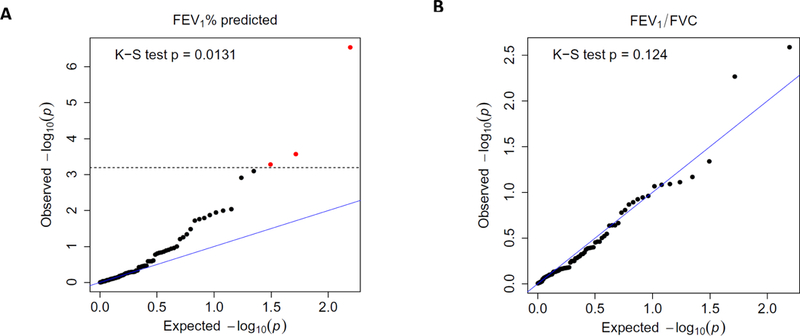
Figure 5. Q-Q plot of the p-values in the association test between respiratory function traits and OTUs.

The x- and y-axis of the plot present the p-values of the association test between respiratory function trait and OTUs. The x-axis is the expected p-value under the null hypothesis that there is no association, and the y-axis is the p-value observed on the actual data. All p-values are –log10 transformed. (A) FEV1% predicted; (B) FEV1/FVC ratio (%). In the linear mixed model, age, gender, height, weight, and smoke were adjusted as fixed effect while 16S sequencing batch and sputum collection date were adjusted as random effect. The overall significance of the enrichment of small p-values was evaluated by a one-side Kolmogorov–Smirnov (K-S) test with respect to a uniform distribution on [0, 1] as null. The blue line has a slop of 1. The dashed line indicates the significance level after Bonferroni correction (0.05/78 = 6.41×10⁻⁴). The OTUs that passed the significance level are highlighted in red.
