
Fig. 5.
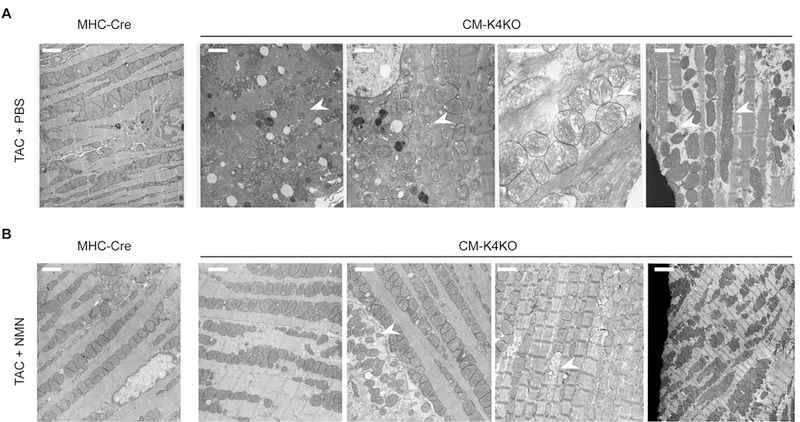
Administration of NMN protected cardiac mitochondria from TAC-induced damage.
(A) EM images from PBS (vehicle) treated hearts after 5 days of TAC.
(B) EM images from NMN (500 mg/kg/day) treated hearts after 5 days of TAC. Scale bar: 1 um. Arrows indicate damaged or abnormal mitochondria. Each image was from individual animal but different areas were chosen to display different phenotype. n = 3 in each group.