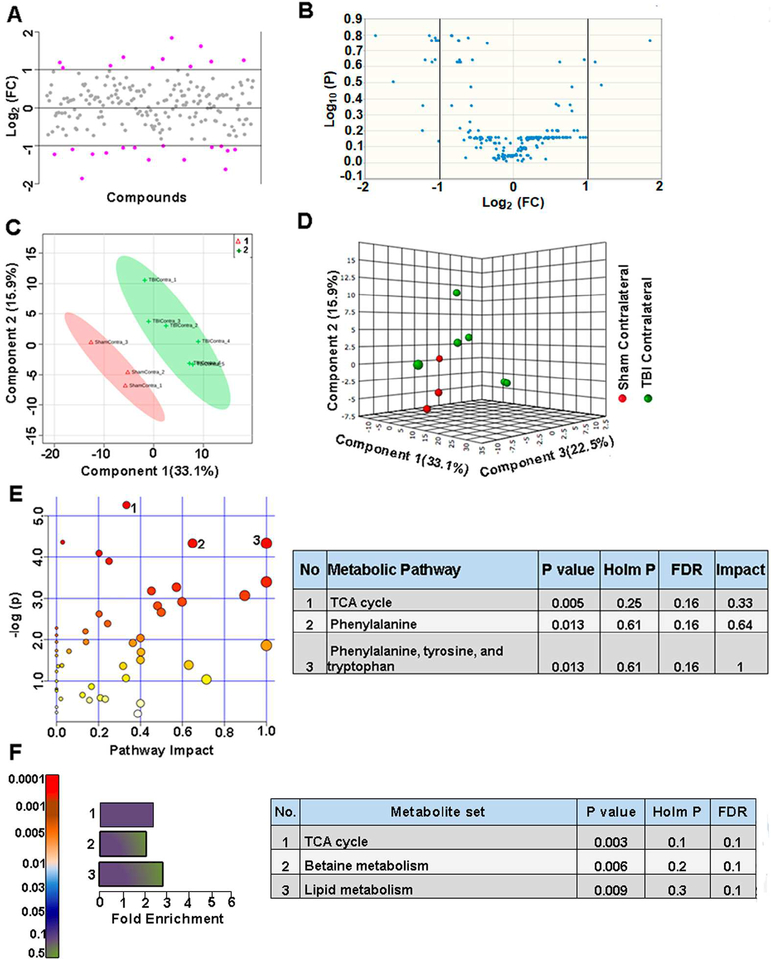
Figure 4. TBI propagates to the contralateral hemisphere, inducing biochemical perturbations.
A) About 14% of the metabolites showed a two-fold difference between sham vs TBI contralateral hemispheres. B) None of the targeted metabolites were significantly different. C) PLS-DA 2D scores plot, D) PLS-DA 3D scoresplot showing partial class separation between Sham contralateral (class 1) vs TBI contralateral hemispheres (class 2). E) MetPA. Left panel figure node colors are based on the p-value and node size on the pathway impact value. Table on the right shows significantly affected metabolic pathways. F) MSEA. Left panel figure y-axis indicates the metabolite set based on the holm p-value and x-axis, the fold enrichment. Table on the right shows affected pathways relevant to significantly enriched metabolite sets.

