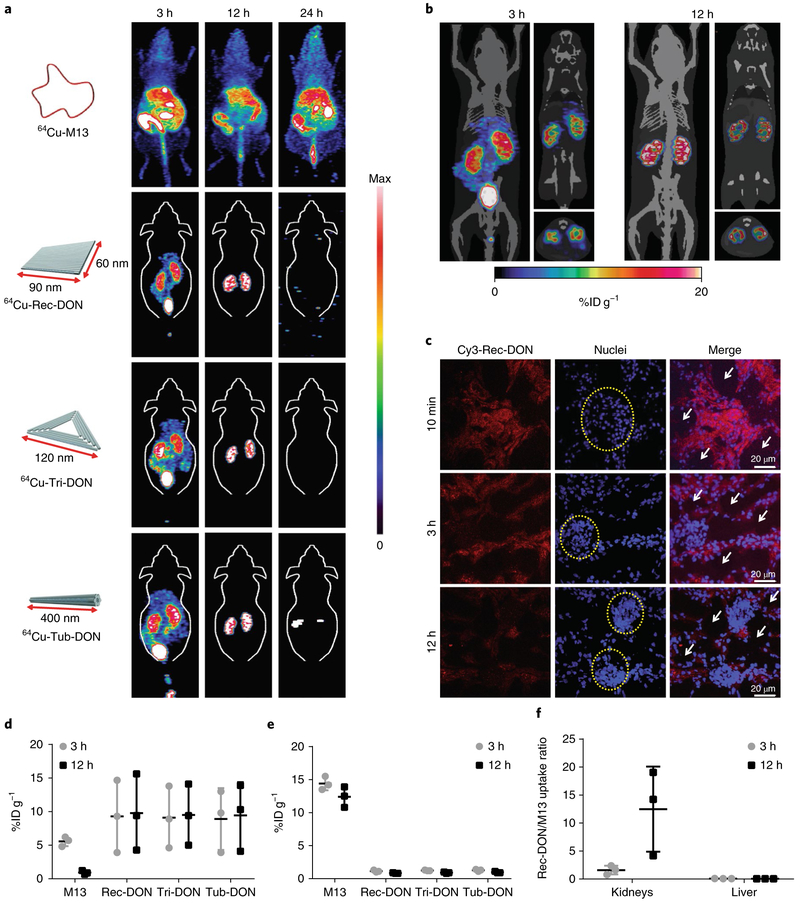
Fig. 2 ∣. Biodistribution of DONs in healthy mice.
a, Maximum intensity projection PET images of 64Cu-labelled M13, Rec-DON, Tri-DON and Tub-DON in healthy mice at 3, 12 and 24 h after intravenous injection. One of three independent experiments is shown. DONs showed selective kidney uptake at 3 h and 12 h post-injection. The accumulation of DNA structures was denoted as the %IDg−1, and the maximum scale bar was 20%IDg−1 for PET images at 3 h and 12 h. At 24 h post-injection, maximum scale bars were 20, 0.1, 0.1 and 0.1%IDg−1 for 64Cu-M13, 64Cu-Rec-DON, 64Cu-Tri-DON and 64Cu-Tub-DON, respectively. b, PET imaging of 64Cu-Rec-DON merged with the computed tomography framework of a mouse at 3 h and 12 h post-injection. One of three independent experiments is shown. The renal cortex is clearly delineated at 3 h and 12 h, demonstrating prominent renal accumulation. The three images for each time point are maximum intensity projection (left), coronal (upper right) and axial slices (lower right). c, Confocal images of kidney sections after intravenous injection of Cy3-labelled Rec-DON (red signal; one of three independent experiments is shown). Nuclei were stained with 2-(4-amidinophenyl)-1H-indole-6-carboxamidine (DAPI; blue). Yellow dashed circles denote glomeruli and white arrows denote renal tubular lumina. d, ROI analysis of kidney uptake at 3 h and 12 h post-injection. e, ROI analysis of liver uptake at 3 h and 12 h post-injection. M13 showed primarily liver uptake and minimal kidney accumulation, whereas all three DONs showed higher kidney accumulation and low liver uptake. f, Ratio of kidney and liver uptake between Rec-DON and M13 at 3 h and 12 h post-injection. In d–f, data represent means ± s.d. from three independent replicates.

