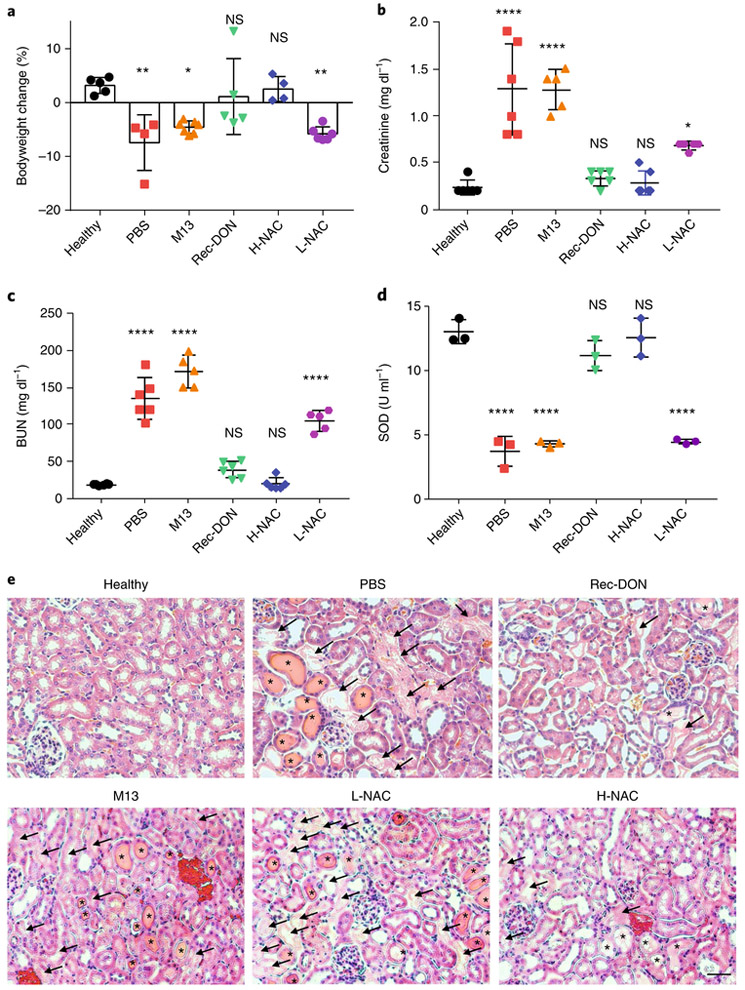
Fig. 6 ∣. Bodyweight change, and blood and kidney tissue analysis after treatment for AKI.
a, Changes in bodyweight at 24 h post-treatment for AKI. A gain in bodyweight indicates treatment efficacy. Refer to Supplementary Table 10 for detailed P values. b, Analysis of creatinine levels in the blood. Lower levels indicate better kidney function. Refer to Supplementary Table 11 for detailed P values. c, Analysis of BUN levels in the blood. Lower levels indicate better kidney function. Refer to Supplementary Table 12 for detailed P values. d, Analysis of SOD levels in kidney homogenate from six groups. Reduced levels suggest enhanced vulnerability of kidney structures to ROS damage. Refer to Supplementary Table 13 for detailed P values. In a–d, data represent means ± s.d. from either four (a), five (b and c) or three (d) independent replicates; statistical significance compared with the healthy group is shown (*P < 0.05, **P < 0.01; ****P < 0.0001; NS, non-significant); and statistical analysis was performed by one-way ANOVA with Tukey's honest significant difference post-hoc test. e, Haematoxylin and eosin staining of kidney tissues from each group. One of three independent experiments from each group is shown. Arrows denote damaged tubules, and asterisks denote the formation of casts—structures formed via precipitation of denatured proteins in the tubules. Scale bar, 50 μm.

