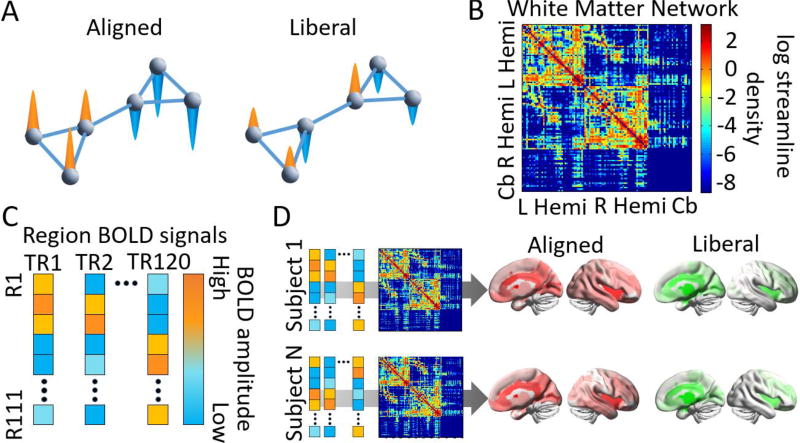
Figure 2. Multimodal approach to the study of cognitive switching using emerging graph signal processing tools.
(A) A notion of signal independence on a schematic modular network. Left: An aligned signal on top of a given graph is one in which the magnitude of functional signals, represented by the directionality of the colored cones, corresponds tightly to that expected by the network’s organization. In this toy example, one cluster of nodes contains similar positive signals, and the other cluster contains similar negative signals. Right: A liberal signal on top of a given graph is one in which signals diverge significantly from the underlying network. (B) For each of the 28 subjects, a white matter graph (a weighted adjacency matrix including white matter streamlines) is constructed from 111 anatomically-defined regions where connections are the streamline density between region pairs. (C) From BOLD fMRI data acquired during the performance of the Navon task, we extract regional mean time series which we treat as graph signals. (D) For each subject, graph signals are decomposed into aligned and liberal components using the underlying eigenspectrum of the white matter graph. Aligned and liberal signals are mapped to the nodes in the brain, and correlated with switch costs estimated from behavioral performance on the task. Cb = cerebellum. TR = repetition time. R = region. See Methods for details.

