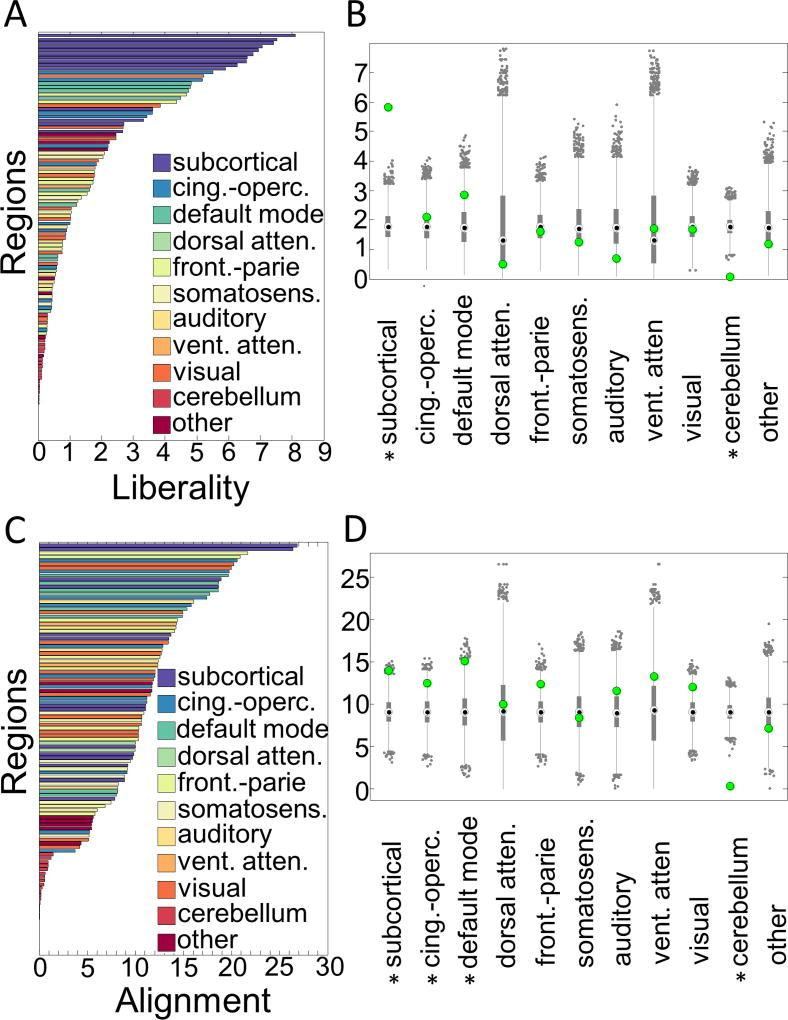
Figure 3. Non-parametric permutation test for signal concentration within cognitive systems.
In the 28 subjects, (A) liberal signal concentrations sorted from highest (top) to lowest concentration across all regions. (B) Liberal signals are most concentrated in subcortical regions. (C) Aligned signal concentrations sorted from highest (top) to lowest concentration across all regions in all 28 subjects. (D) Aligned signals are most concentrated in fronto-parietal, cingulo-opercular, default mode, and subcortical systems. The bars in panels (A) and (C) represent the mean signal liberality or alignment in the 111 regions color coded by their system assignment. The x-axes for the same panels represent the Graph Fourier Transformed signal values at each region, where increasing values represent more liberality in panel (A) and more alignment in panel (C). In panels (B) and (D), the gray bars represent the 25th and 75th percentiles of the values in the null permutations, the gray whiskers extend to the most extreme data points not considered outliers, and the gray dots represent outliers in the permutation distributions. The green dot represents the observed value for the system. An ∗ indicates a statistically significant signal concentration in the system relative to the null distribution in the permutation test (p<0.05). Cing.-operc = cingulo-opercular; atten = attention; front.-parie = fronto-parietal; somatosens = somatosensory; vent = ventral.

