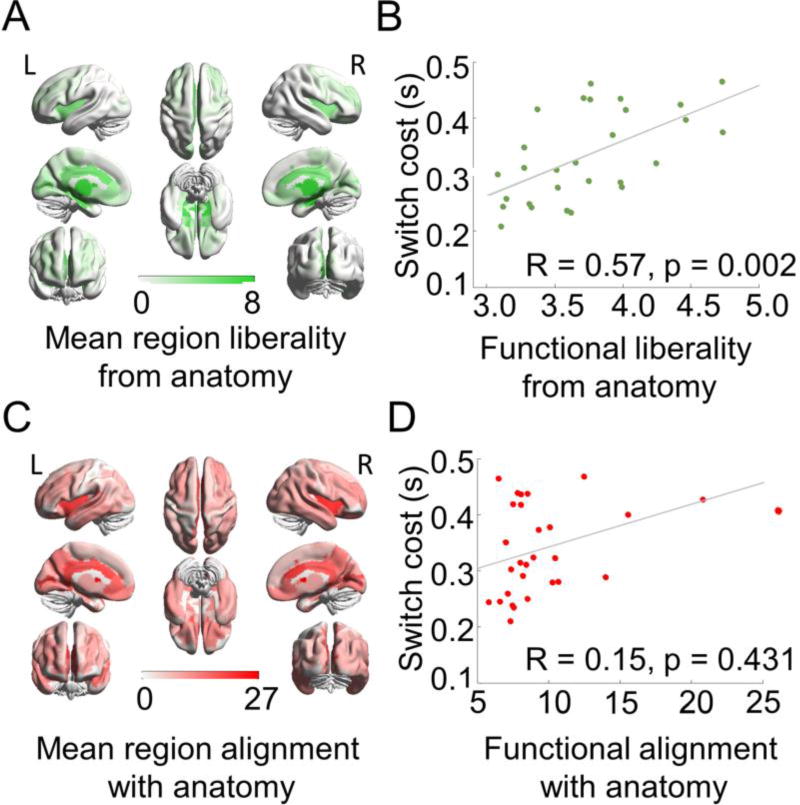
Figure 4. Lower independence is associated with lower switch costs.
In the 28 subjects, (A) liberal signals are concentrated especially in subcortical regions and cingulate cortices. (B) Reduced liberality (increased alignment) is associated with reduced switch costs across subjects. (C) Aligned signals are concentrated especially in subcortical, default mode, fronto-parietal, and cingulo-opercular systems. (D) Variability in aligned signals was not significantly associated with switch costs across subjects. In panels (A) and (C), the colorbars represent the Graph Fourier Transformed signal values at each region, where increasing values represent more liberality or alignment, respectively. In panels (B) and (D), the x-axes represent the mean liberality or alignment across regions of the brain, and the y-axes represent the mean switch cost during the Navon task. L = left hemisphere, R = right hemisphere.

