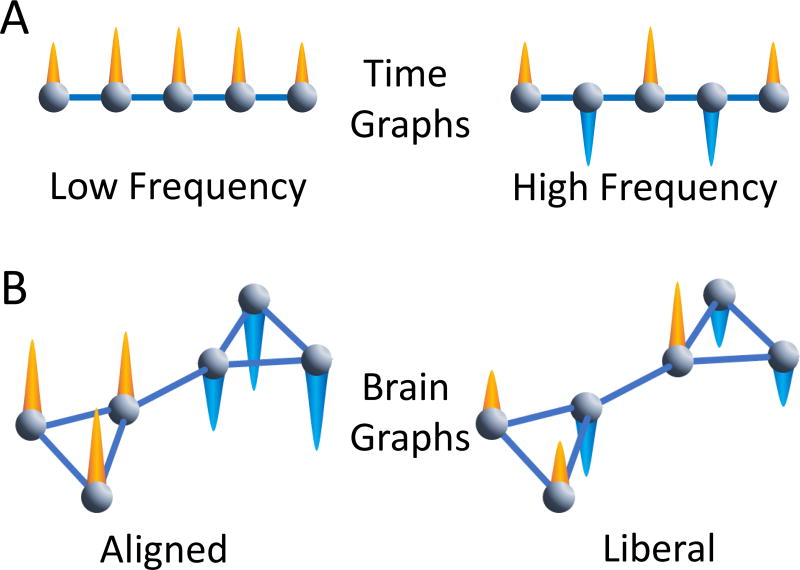
Figure 5. Signal frequency in the time domain versus alignment in the graph domain.
(A) A simple graph can represent a signal process in time. Imagine that the nodes in the graph are moments in time, and the edges between nodes represent links between adjacent moments in time. The image on the left then represents a low frequency signal process where the orange cones represent positive signals that do not vary significantly with respect to the time dimension. The image on the right represents a high frequency signal process where the orange cones represent positive signals and the blue cones represent negative signals. The signals flip from moment to moment, which is the basis of a high frequency signal. A traditional Fourier analysis on real signals can separate both high and low frequency activity observed in a single set of nodes (moments in time). (B) We can extend this notion directly to more complex graph structures such as those observed in human brain networks with the Graph Fourier Transform. As in the time graph in panel (A), we observe nodes, edges, and a signal at each node. Unlike the time graph, which constitutes a linear ordering of connected nodes, the more complex graph may have modules and other mesoscale features. On the left, we observe an aligned signal: the signals in nodes that highly connect to one another exhibit similar signals to one another. On the right, the signal is liberal with respect to the underlying graph: the signals in nodes that highly connect to one another do not exhibit similar signals to one another. In real signals, such as BOLD signals observed at a single moment in time, each node can contribute signals that may be to some extent aligned and to some extent liberal.

