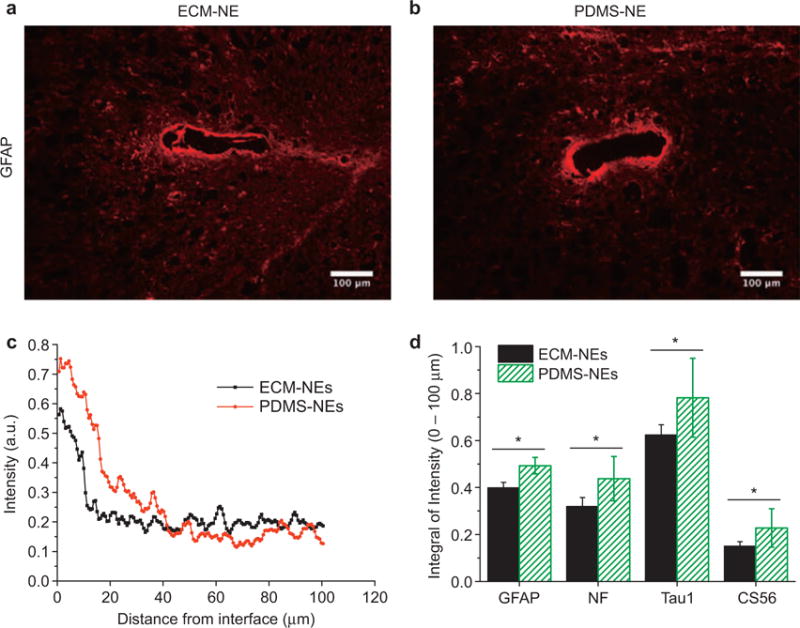
Figure 7.

Histology of tissue response to chronically implanted NEs. (a) and (b) immunohistochemically marked glial fibrillary acidic protein (GFAP) in the tissue that had been implanted with NEs for 16 weeks: (a) ECM-NEs, (b) PDMS-NEs; (c) average image intensities of immunohistochemically marked GFAP were computed up to a distance of 100 μm from the brain tissue–device interface. (d) Integrated image intensities of immunohistochemical markers for the reactive astrocyte responses were computed up to a distance of 100 μm from the brain tissue–NE interface. Significant differences observed between the ECM-NEs and PDMS-NEs in the integrated image intensities of immunohistochemical markers are represented by *, indicating p < 0.05.
