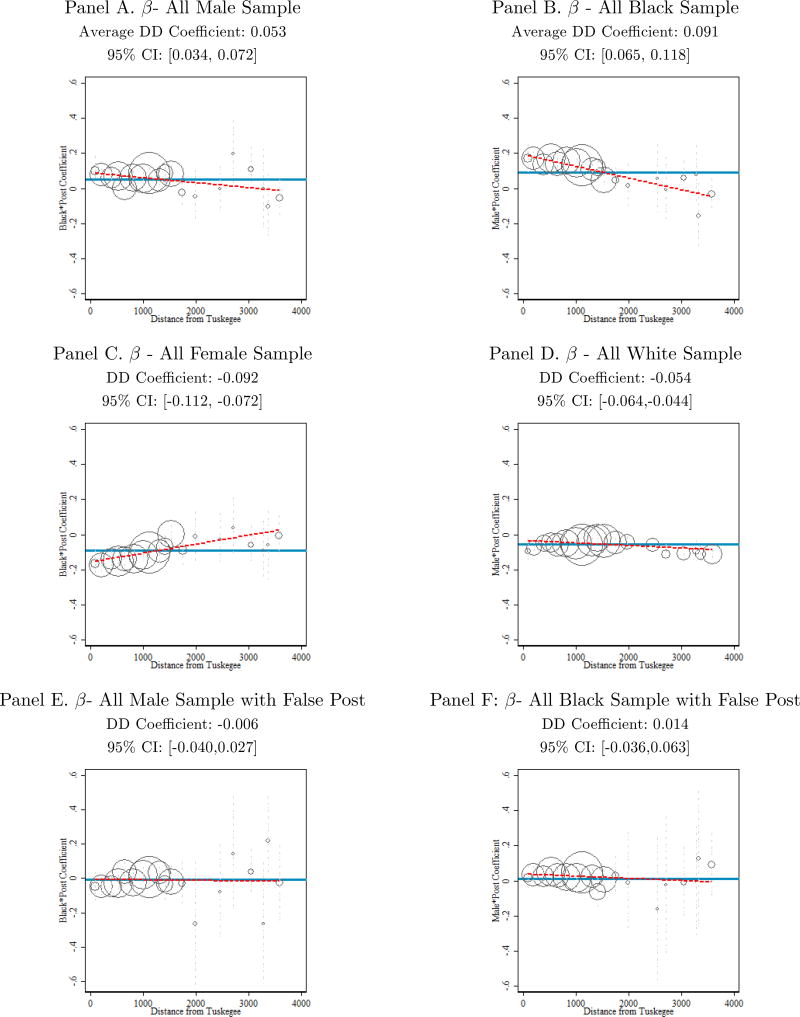
Figure III. Difference-in-Differences Coefficients and Geographic Gradients for Chronic Cause Mortality.
Notes: These figures plot β coefficients from equation (1) estimated on various demographic group samples (all-male, all-black, all-white and all-female) as indicated by the figure headings and further subdivided into distance bins from Tuskegee. The outcome variable for each regression is the log of age-adjusted chronic mortality. Panels (A) and (B) plot β coefficients on black*male*post in the all-male and all-black sample, respectively. Panels (C) and (D) plot β coefficients on white*male*post and black*female*post in the all-white and all-female sample, respectively. Panels (E) and (F) plot the same coefficients as in Panels (A) and (B), however, the time period of the analysis is restricted to the pre-1974 period with all observations after 1969 constituting the “post” period. SEAs were grouped into K bins of 150 kilometers of distance from Macon County, Alabama each bin yielding a βk. Bins in the middle of the country with less than 2,500 black men in 1970 were combined, and confidence intervals that were greater than 0.6 in absolute value were omitted so that the scale could be the same for all figures. Regressions for a given bin were weighted by the relevant SEA population (e.g. 45–74 year old males for the all-male sample), and the size of the bubble reflects the total weight of the respective treated population within each distance bin. Each βk coefficient is indicated by a bubble and the dashed vertical lines connected to the bubble denote its 95% confidence interval. The thick (blue) line depicts the average β coefficient across the entire subsample. This average estimate and its 95% confidence interval are provided in the figure subheading. The line of best fit between the β coefficients and distance from Tuskegee is drawn as a dashed (red) line. Data are from the CDC compressed mortality files and cover the period 1968 to 1987 unless otherwise indicated. Rates are constructed biennially, and post is an indicator equal to 1 in the years following 1972/1973 for Panels (A) through (D). Placebo post is an indicator equal to 1 in the years 1970/1971 and covers the period 1968 to 1973. See main text and Appendix for further details on the data source and variable construction.

