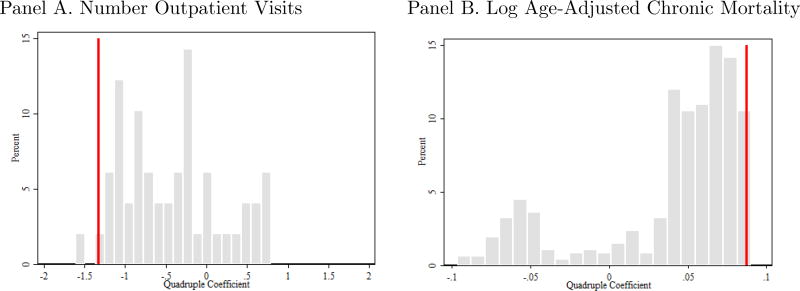
Figure V. Permutation Test.
Notes: Frequency of the “false” β1 coefficient estimated using distance from every other state (exclusive of Alabama) or SEA (exclusive of the one containing Macon County) in the sample and estimating equation (2) in Panel (A) or equation (3) in Panel (B). The vertical line denotes β1 from baseline estimates using the true treatment distance (to Macon County, Alabama) as reported in Table I.

