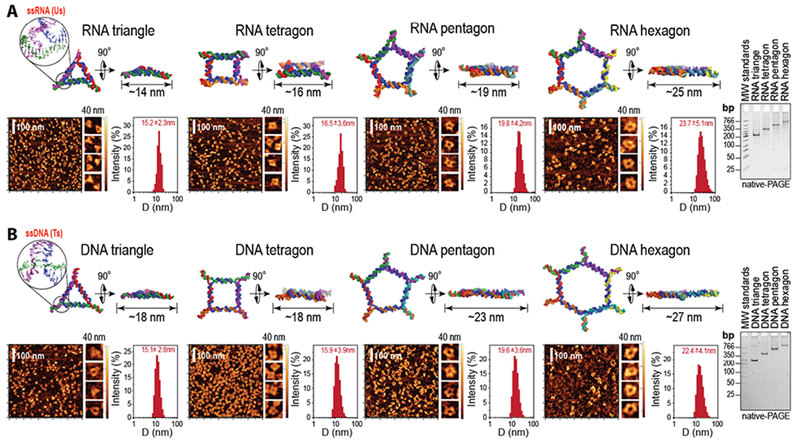
Figure 1:

Programmable nucleic acid RNA (A) and DNA (B) polygons. Each panel presents energy minimized 3D models of RNA and DNA nanoparticles (identical sequences are colored the same), with corresponding AFM images, hydrodynamic radii measured by DLS (presented as +/− SEM), and ethidium bromide total staining native-PAGE results. “MW standards” denote the low molecular weight DNA ladder (NEB) used as the size marker.
