Figure 2:

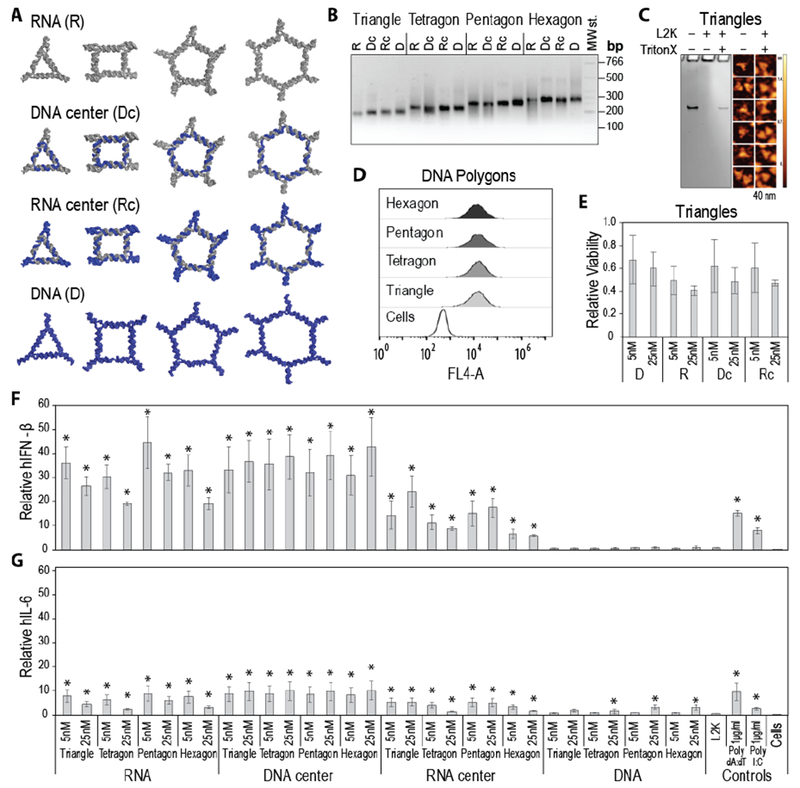
Cell culture experiments with programmable polygons. Human microglia-like cell lines were transfected with polygons at a final concentration of 5 nM and 25 nM. (A) 3D models of tested polygons with RNA strands shown in grey and DNA strands in blue. (B) Assemblies all polygons visualized by agarose gel. “MW st.” denotes the low molecular weight DNA ladder (NEB). (C) Structural integrity of polygons associated with Lipofectamine 2000 (L2K) confirmed by the release studies with Triton X100. The results are analyzed by native-PAGE and visualized by AFM. (D) Relative cellular uptakes assessed by flow cytometry and (E) cell viability assays of polygons transfected with L2K. Polygons tested without L2K showed negligible change in cell viability (data not shown). (F-G) 24 hours post transfection with 16 RNA, DNA and RNA/DNA polygons, cell supernatants were collected and levels of IFN-β (F) and IL-6 (G) production were assessed by specific-capture ELISA. In C, E, and F, results were normalized to transfection reagent alone treated cells (L2K) and presented as the mean +/− SEM. Statistically significant results are indicated with asterisks (p value < 0.05).
