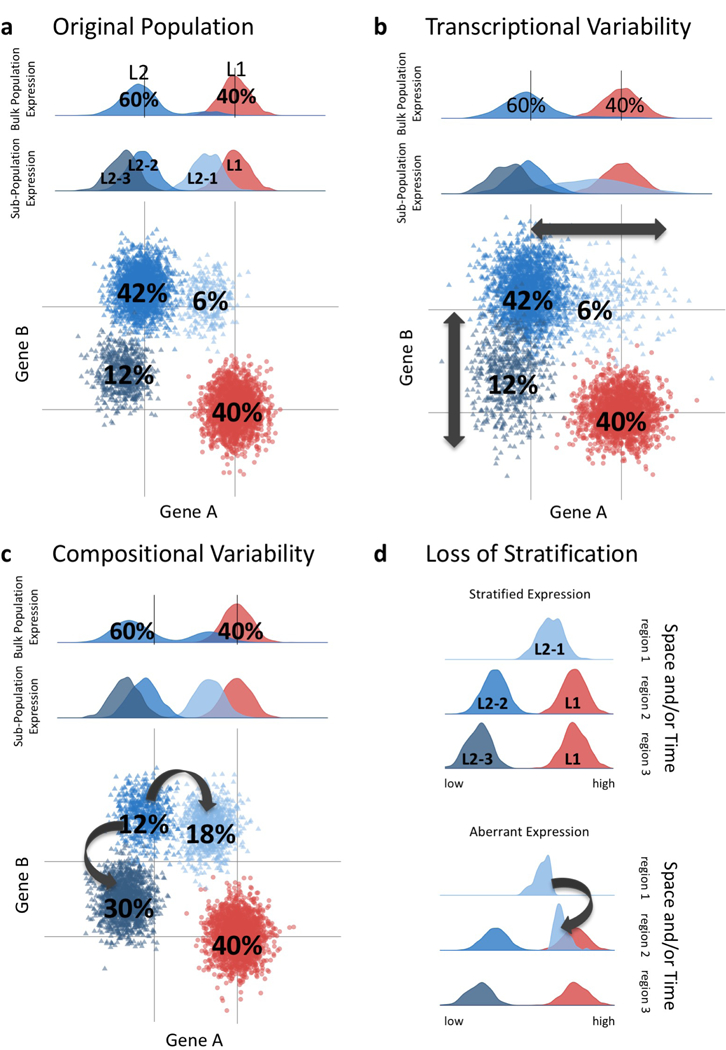
Figure 2-. Proposed etiology of aging-associated transcriptional variability.

There are multiple routes to achieve age-associated variability among the cells that derive tissues. Hypothetical single-cell RNA sequencing shows heterogeneity of cell populations within a tissue. (a) Two hypothetical lineages each with a given frequency: L1=40% and L2=60% are depicted. At single cell resolution, one can observe multiple sub-populations of L2, e.g. L2–1 (6%), L2–2 (36%), and L2–3 (18%). Histograms of expression of Gene A of the bulk population and sub-populations shown in the top two panels. Dot-plot showing lineage-specific expression of Genes A and B are shown in the bottom panel. (b) Increased transcriptional variability with age has been reported. A hypothetical example in shown whereby expression of Genes A and B in the L2 sub-populations increases in variance, leading to an apparent loss of lineage-specific expression with age. (c) Changes with age in the composition of lineages that comprise a tissue has been reported. Change in sub-population frequency is shown with reduction of L2–2 (12%), and increases of L2–1 (18%) and L2–3 (30%) sub-populations with age. This could occur either via shift in lineage bias or by fate drift. (d) Loss of stratification with age is another hypothetical means of increasing transcriptional variability. Stratified expression of the original population in time and/or space is shown in the top panel. Loss of stratified expression with age is illustrated in bottom panel with half of L2–1 showing aberrant timing and/or spatial localization.
