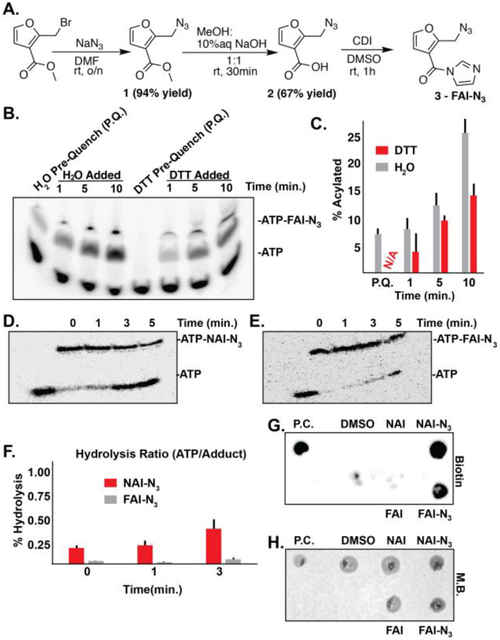
Figure 2. Synthesis and evaluation of FAI-N3 for hydroxyl acylation.
A). Synthesis of FAI-N3. B). DTT quenching of FAI-N3 acylation. Pre-quench (P.Q.) is designated for addition of either water or DTT to the ATP solution before the addition of FAI-N3 C). Bar-graph detailing the percent acylation (monoacylation) as a function of time in quenching conditions represented in Panel B. Black bars denote error from biological triplicates. N/A is abbreviated for no acylation observed. D). Stability of NAI-N3 at 95 °C. E). Stability of FAI-N3 at 95 °C. F). Bar-graph detailing the percent hydrolysis as represented in Panel D and E. Black bars denote error from biological duplicates. G). Dot blot demonstrating successful “click” for biotinylation of FAI-N3 acylated RNA. H). Methylene blue staining of G. Biotin = streptavidin dot blot. M.B. = methylene blue. P.C. = positive control bioinylated oligo.

