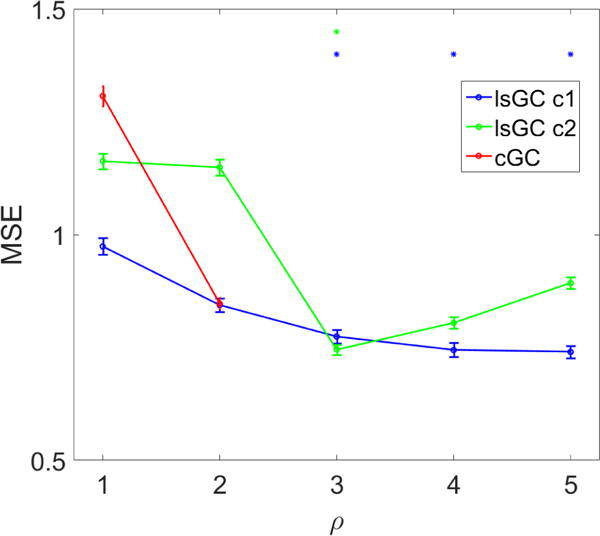
Figure 3.

Overall NP score prediction with SVM. Error bars represent the standard error of the mean over 100 iterations of 10-fold cross-validation. Blue and green asterisks (*) represent entries where the MSE of lsGC at c = 1 or c = 2, respectively, was significantly lower than that of the lowest cGC MSE (p < 0.001 using a one-tailed paired t-test). Performance of all methods was highly sensitive to choice of parameters. At ρ ≥ 3, lsGC at c = 1 outperforms cGC with optimal parameters (ρ = 2). LsGC at c = 2, however, performs progressively worse at ρ ≥ 3. This figure shows that if the model parameters are chosen well, lsGC has the potential to yield superior performance to cGC. Further research into model selection criteria for lsGC is necessary.
