Figure 8.

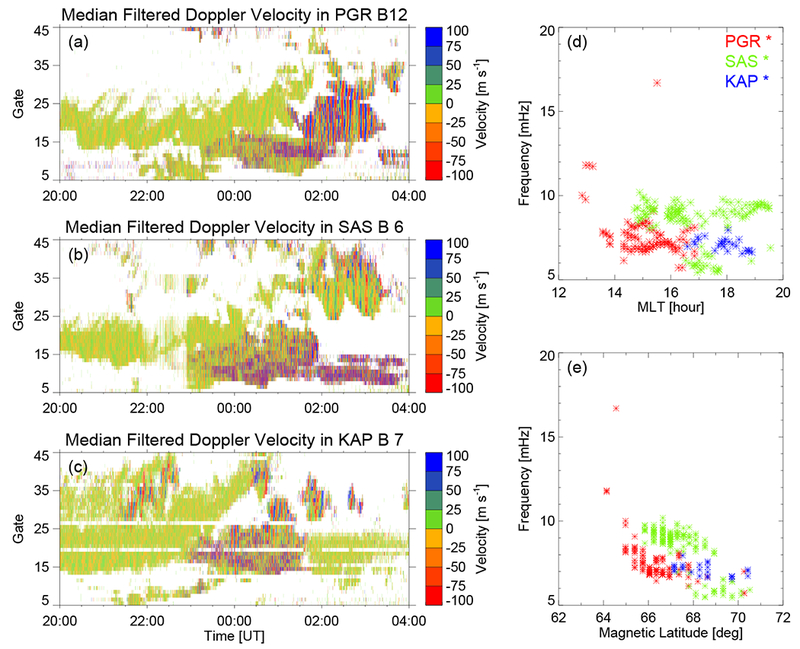
(Left) The range-time intensity plot for (a) PGR, (b) SAS, and (c) KAP radar from 2016-01-24/20:00 UT to 2016-01-25/04:00 UT. (Right) Frequency versus (d) MLT and (e) magnetic latitude distribution of wave events.

(Left) The range-time intensity plot for (a) PGR, (b) SAS, and (c) KAP radar from 2016-01-24/20:00 UT to 2016-01-25/04:00 UT. (Right) Frequency versus (d) MLT and (e) magnetic latitude distribution of wave events.