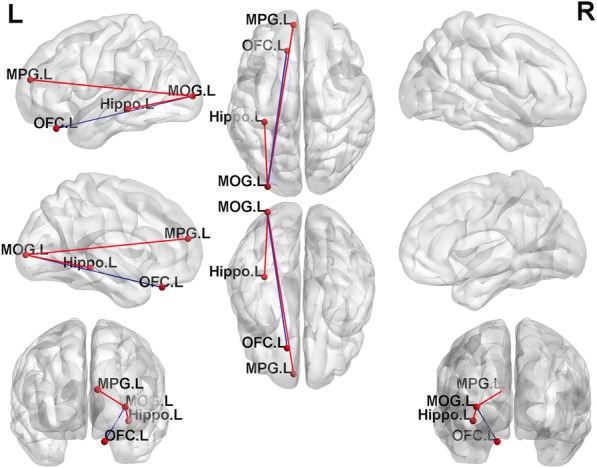
Fig. 3.

Graph visualization of functional connectivity comparison differences. Compared with healthy controls, female major depressive disorder patients show significantly increased FC of left middle occipital gyrus (MOG.L) with left medial prefrontal gyrus (MPG.L) and left hippocampus (Hippo.L) and significantly decreased FC between L-MOG and left orbitofrontal cortex (OFC.L) L, Left. The red line refers to higher FC, and the blue line refers to lower FC
