
Figure 1:
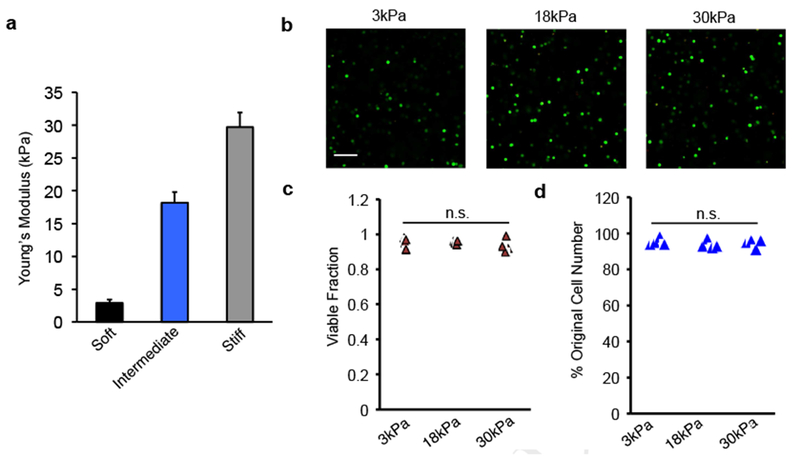
Alginate hydrogel and mMSC encapsulation characterization.
-
a)Young’s Moduli of alginate hydrogels used for mMSC culture. Mean + S.D.
-
b)Viability staining of mMSCs embedded in alginate hydrogels for the three gel moduli after 2 days in culture. Live cells stain green and dead cells stain red. Scale bar - 100μm.
-
c)Quantification of fraction of viable cells in hydrogels after 2 days in culture, computed from five representative fields of view for each gel. Triangles represent individual gels. Cells were segmented and counted using ImageJ. No statistically significant difference was found with ANOVA.
-
d)Percentage of original mMSC cell numbers after 2 days in culture in alginate hydrogels. Triangles represent individual gels. No statistically significant difference was found with ANOVA.