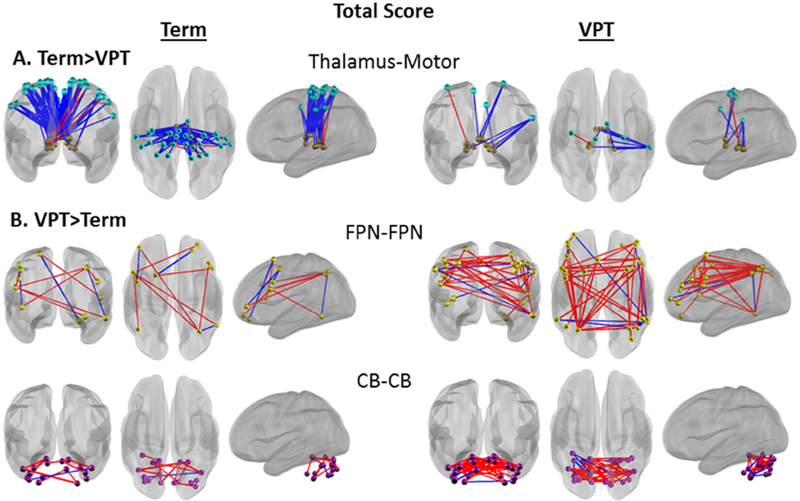
Figure 4.

Network pair connectivity correlated with MABC Total Standard Score. Blue lines represent a negative brain-behavior correlation, red lines represent a positive brain-behavior correlation. A) Greater enrichment of strong brain-behavior correlations in term (brains on the left) than very preterm (brains on the right) children. B) Greater enrichment of strong brain-behavior correlations in very preterm than term children. All correlations shown at p<0.05. FPN, Frontoparietal Network; CB, Cerebellum.
