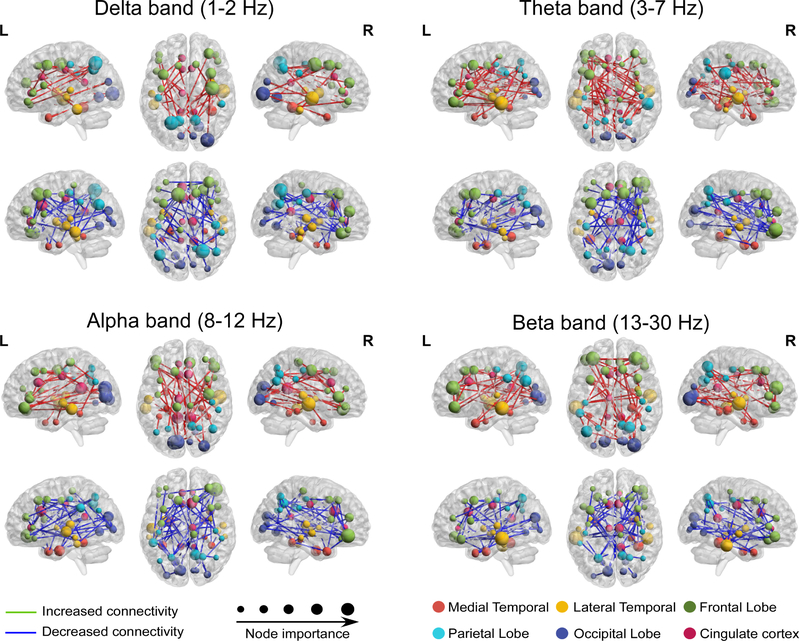
Figure 3. Brain connectivity significantly changed after conditioning.
Brain activity in cortical space was bandpass filtered into four different frequency bands and brain connectivity was constructed between each pair of sources. Significantly increased (red lines) and decreased (blue lines) brain connectivities after conditioning were retained as features for regression analyses. Node importance denotes the number of connections from the node to other nodes.

