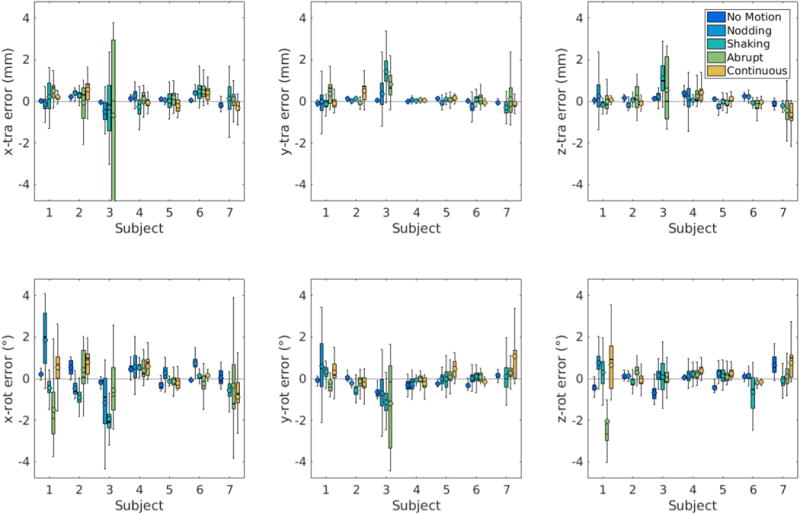
FIG. 6.

FIDnav motion prediction errors for all subjects and motion paradigms, plotted for translation and rotation about the x, y and z-axes. Boxplots visualize the distribution of the error and encapsulate data between the 25th (Q1) and 75th (Q3) percentiles i.e. the interquartile range (IQR), with the whiskers extending to the maximum errors not considered outliers (defined as data points further away from Q1 or Q3 by 1.5[IQR]). The median (solid line) and mean (open circle) errors are also shown. Overall, FIDnav motion predictions achieved good accuracy and precision, relative to the EM tracking system; however, larger errors are evident for some volunteers and motion paradigms.
