
FIG. 7.
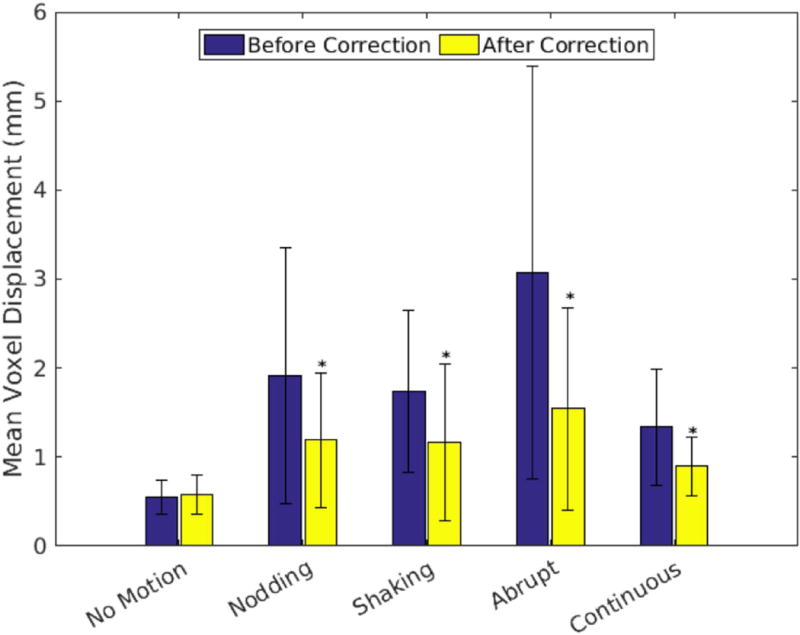
Summary of motion levels before and after FIDnav correction across different motion paradigms. MVD is calculated within the masked brain region from rigid-body motion estimates from the EM tracking system (blue bars). Yellow bars show the residual MVDs after correction with FIDnav motion estimates. FIDnav motion correction results in a significant (P<0.05; denoted by *) decrease in MVD across all volunteers and scans with intentional motion.