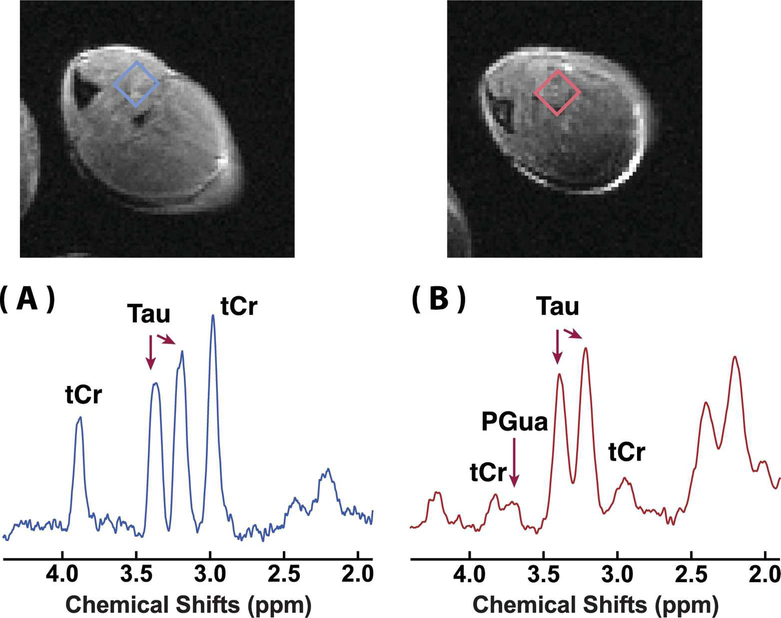
Figure 1.
In vivo 1H NMR spectra of the skeletal muscle of (A) a WT mouse and (B) a GAMT−/− mouse. The corresponding T2 weighted images (RARE sequence, in-plane resolution 170 × 170 μm2, slice thickness 1.5 mm) are also shown. The rectangles indicated on the T2 weighted images were selected as volumes of interest (VOIs) for the spectra. The assignment of the MRS peaks is also indicated.

