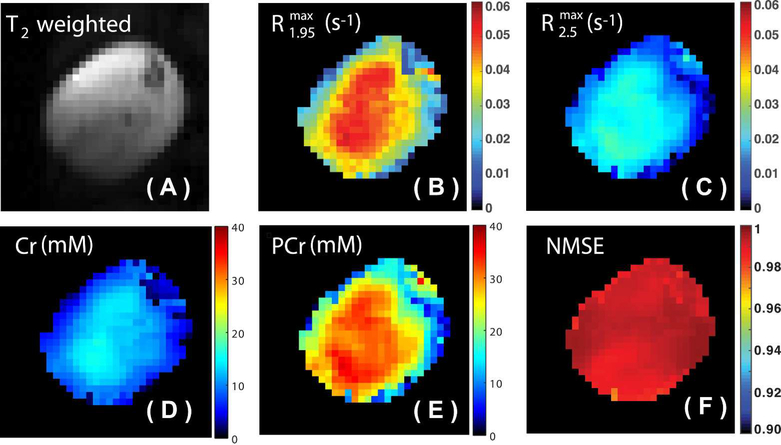
Figure 4.
(A) T2 weighted image of the mouse hind leg used for anatomical guidance. The extracted maps of (B) and (C) determined by the PLOF method using the Z-spectrum recorded with a saturation power of 1 μT. (D) The Cr and (E) PCr concentration maps calculated using Eqs. 9 and 10, respectively. (F) The NMSE map calculated using Eq. 11 for evaluating the PLOF fitting.

