
Figure 2.
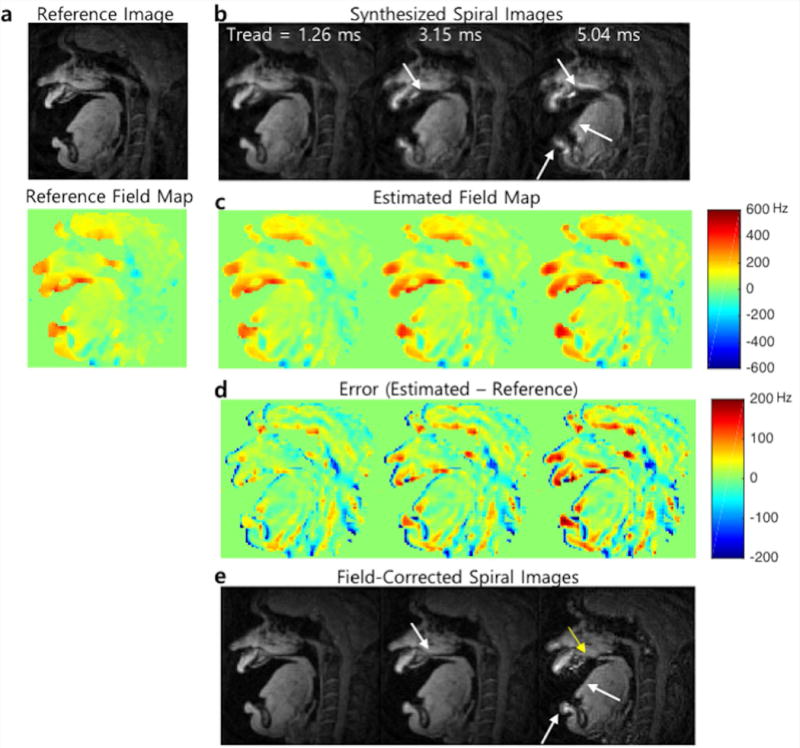
Representative simulation results. (a) A magnitude image and reference field map acquired from Cartesian dual-TE acquisition. (b) Synthesized spiral images using the magnitude image and reference field map with different readout durations (1.26, 3.15, and 5.04 ms). Off-resonance blurring is most apparent near the lips, hard palate, and tongue boundary and becomes worse with the longer readouts. (c) Field maps (Unit: Hz) estimated from phase of the spiral complex images shown in (b). (d) Estimation errors in the field map (error maps amplified by a factor of 3 for better visualization). (e) Spiral images after correction for off-resonance based on the estimated field map represented in (c).